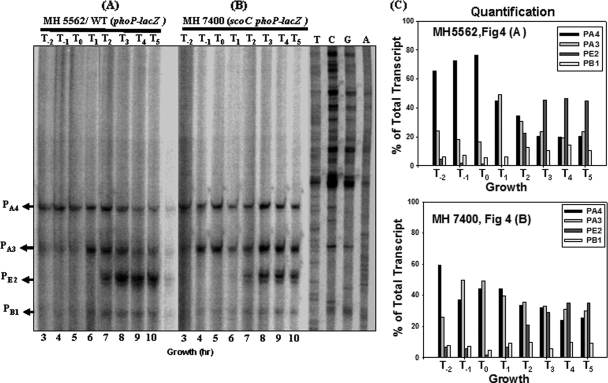
FIG. 4.
Primer extension analysis of the phoPR promoter region from the total RNA isolated from a WT (MH5562) or a scoC strain (MH7400) grown in LPDMG. The end-labeled primer FMH1025 was annealed to RNA isolated from exponential phase, transition stage, or postexponential phase cultures. (A) Lanes 3 to 10 show the primer extension reactions of RNA samples taken from a WT strain (MH5562) growing in LPDMG at the times indicated. The expression from four transcriptional start sites (PB1, PE2, PA3, and PA4) is indicated with arrows. T0 is the time of Pho induction and T1, T2, T3, T4, and T5 are 1, 2, 3, 4, and 5 h of growth, respectively, in LPDMG after Pho induction. T−2 and T−1 samples were taken at 2 h and 1 h before Pho induction, respectively. (B) Lanes 3 to 10 show the primer extension of RNA samples taken from the scoC (MH7400) strain at the times indicated. (C) Quantification of individual transcripts. Radioactivity was determined in arbitrary units for each transcript by phosphorimaging. The sum of all transcripts from a reaction was considered 100%. The percent contribution of each transcript to the total transcription from each primer extension reaction was calculated and plotted in a set of bar graphs. The time of RNA sampling was indicated relative to Pho induction, T0. Bars correspond to PA4, PA3, PE2, and PB1, respectively.

