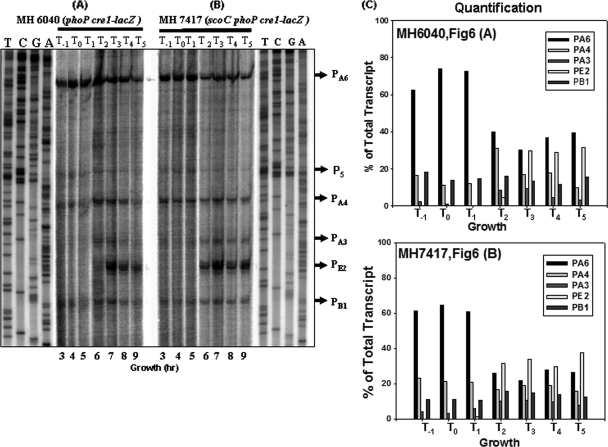
FIG. 6.
Primer extension analysis of the phoPR promoter region from the total RNA isolated from the phoP cre1-lacZ (MH6040) strain or scoC phoP cre1-lacZ (MH7417) strain grown in LPDMG. The end-labeled primer FMH1025 was annealed to RNA isolated from exponential phase, transition stage, and postexponential phase cultures. (A) Lanes 3 to 9 show the primer extension reactions of RNA samples taken at 3 to 9 h from the phoP cre1-lacZ (MH6040) strain grown in LPDMG (Fig. 5) at the times indicated. T0 is the time of Pho induction, and T1, T2, T3, T4, and T5 are 1, 2, 3, 4, and 5 h of growth, respectively, after Pho induction in LPDMG. T−1 is 1 h before Pho induction (growth hour 3). Promoter expression from six transcriptional start sites, PB1, PE2, PA3, PA4, P5, and PA6, is indicated with arrows. (B) Lanes 3 to 9 show the primer extension of RNA samples taken at the indicated times from the scoC phoP cre1-lacZ (MH7417) strain. (C) Quantification of individual transcripts as described for Fig. 4. Bars correspond to PA6, PA4, PA3, PE2, and PB1, respectively.

