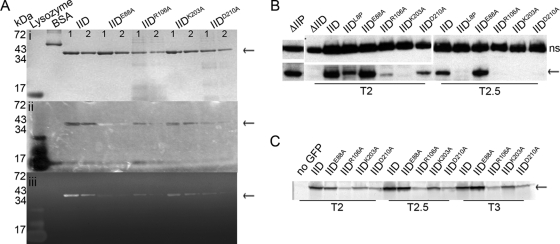
FIG. 4.
Biochemical tests of SpoIID. SpoIID is indicated with arrows. (A) Renaturing gel electrophoresis assay for cell wall degradation (zymography). Purified SpoIID and mutant SpoIID proteins were run on two SDS-PAGE gels. Band size is indicated on the left and amount of protein loaded is at the top of each column: lane 1 for each protein contains 2 μg, and lane 2 contains 1 μg. (i) Gel stained with Coomassie blue to visualize protein purity and concentration. (ii) Photograph of gel containing M. luteus cells as substrate and incubated overnight in renaturing solution. The gel was imaged without stain and over black paper, with clearing evidenced by the appearance of the black background through the opacity of the gel. SpoIIDE88A appears as an opaque band. (iii) Same gel as in panel ii, with the peptidoglycan stained with methylene blue before imaging on a Typhoon scanner. Clearing indicates peptidoglycan degradation. Lysozyme is a positive control for peptidoglycan degradation and bovine serum albumin (BSA) is a negative control. (B) Western blot of SpoIID protein levels. Mutant constructs are inserted at amyE and indicated above each column; time of sample collection (after sporulation initiation) is below. The upper panels show a nonspecific (ns) band bound by the SpoIID antibody and used as a loading control. Lower panels show SpoIID. (C) In-gel GFP fluorescence of GFP-SpoIID levels. Cell extracts were collected from cultures containing the GFP-SpoIID fusion protein indicated above each column at the time indicated below. Extracts were run on SDS-PAGE gels, and GFP was visualized directly using a Typhoon imager.

