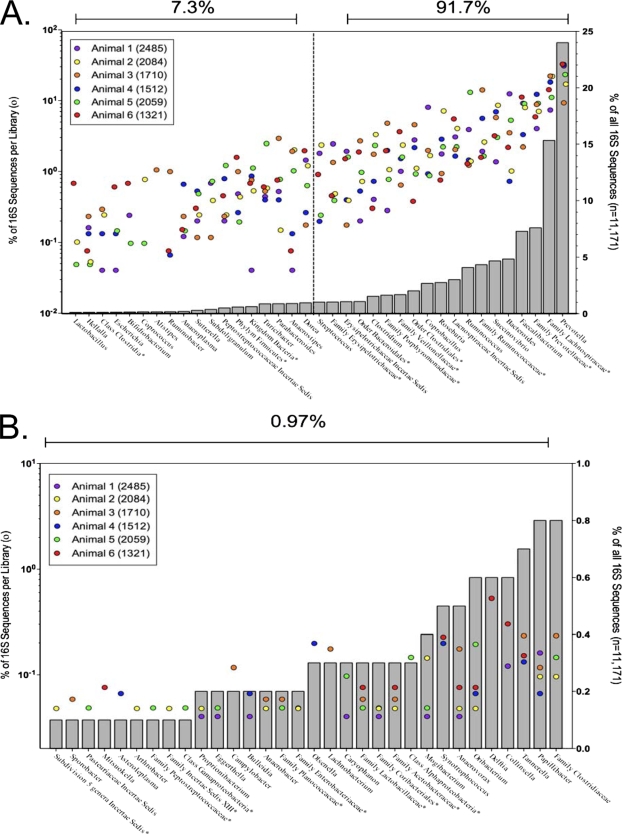
FIG. 1.
Bacterial diversity of six feedlot beef cattle. Gray bars represent the percentages of all 16S sequences that were assigned to each taxonomy. Colored dots represent the percentages of 16S sequences from each library that were assigned to each taxonomic group. Asterisks indicate unclassified members of the named taxon. Panel A shows the data for the first 99% of all the sequences. Panel B shows the data for the remaining 1% of sequences. Note differences in scales for panels A and B.

