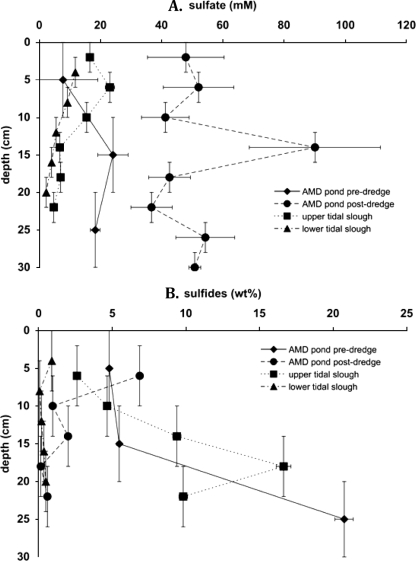
FIG. 2.
Concentration profiles of pore water sulfate (A) and extractable sulfide minerals (B) with depth for Stege Marsh sampling sites. x axis uncertainties represent 2 standard deviations from the mean and estimated weighing precisions for sulfate and sulfides, respectively. y axis uncertainties reflect scales of homogenization of samples obtained from sediment coring.

