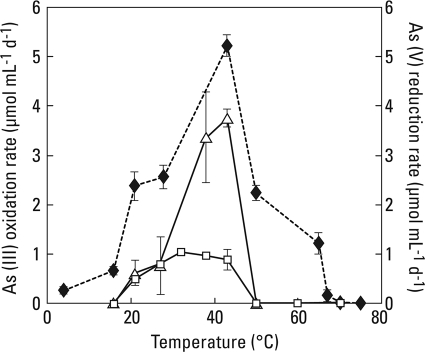
FIG. 3.
Temperature range experiment for anaerobic biofilm materials and strain PHS-1. Symbols: ⧫, As(V) reduction rates for dark-incubated biofilm; Δ, As(III) oxidation rates for light-incubated slurries; □, As(III) oxidation rates for light-incubated strain PHS-1. All symbols represent the mean rates calculated for three incubated samples, with error bars indicating ±1 standard deviation.

