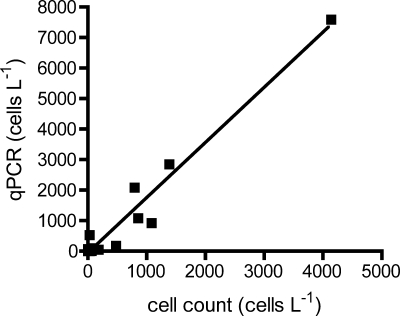
FIG. 2.
A plot of A. catenella abundance data generated by qPCR or direct cell counts of fixed material for Puget Sound stations where both samples were analyzed. The qPCR assay generates cell numbers roughly two times (slope, 1.809 ± 0.08774) higher than microscopic cell counts (r2 = 0.9572; P < 0.0001).

