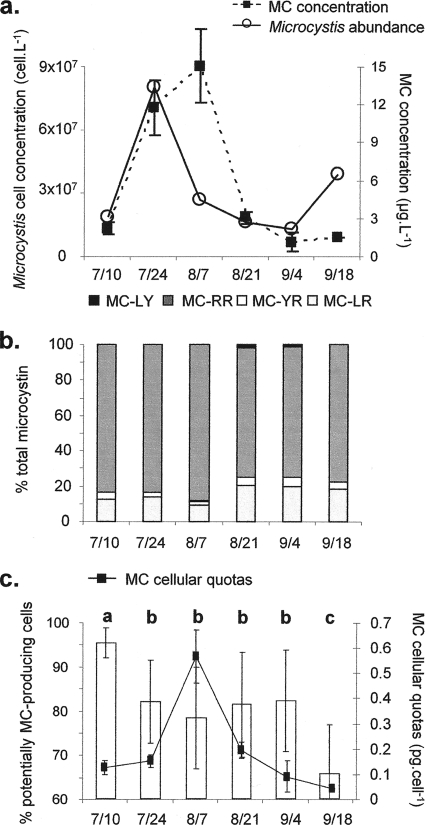
FIG. 2.
Temporal dynamics of Microcystis population, the potentially MC-producing cells, and microcystin in the Grangent Reservoir in 2006. (a) Microcystis cell and microcystin concentrations; (b) distribution of microcystin variants expressed as a percentage of total microcystin; (c) proportion of potentially MC-producing cells (histograms) and MC cellular quotas. The error bars indicate standard deviations. Different letters indicate significant differences in the proportion of potentially MC-producing cells.

