Figure 3.
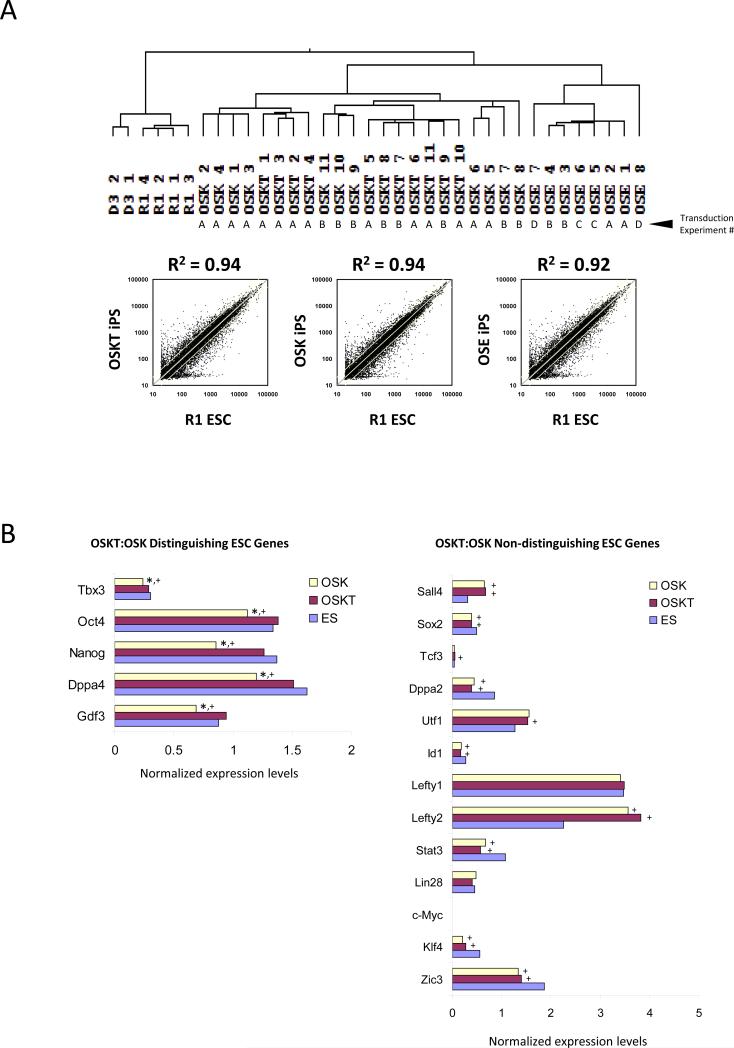
Transcriptome of iPS cell clones generated with different combinations of reprogramming factors. (A) Hierarchical clustering of global expression profiling showed that OSKT and OSK clones are more similar to wild-type ESCs than OSE, but indistinguishable from each other based on correlation coefficient. R2 value was obtained from the average individual gene signal intensity of all iPS clones in each combination and compared against R1 ESCs. The independent transduction experiments where the clones were isolated are denoted as A, B, C, and D. (B) Analysis of individual ESC-associated gene profiles revealed a subset that could distinguish OSKT from OSK-derived iPS cells. ‘Distinguishing’ ESC genes were expressed at levels similar between OSKT and ESCs but significantly lower in OSK. The majority of other ESC-associated genes were ‘non-distinguishing’ and present at levels similar between both OSKT and OSK. * denotes significantly different from OSKT; + denotes significantly different from ESC; p<0.05. Changes in gene expression based on microarray were confirmed with qPCR (Figure S11).

