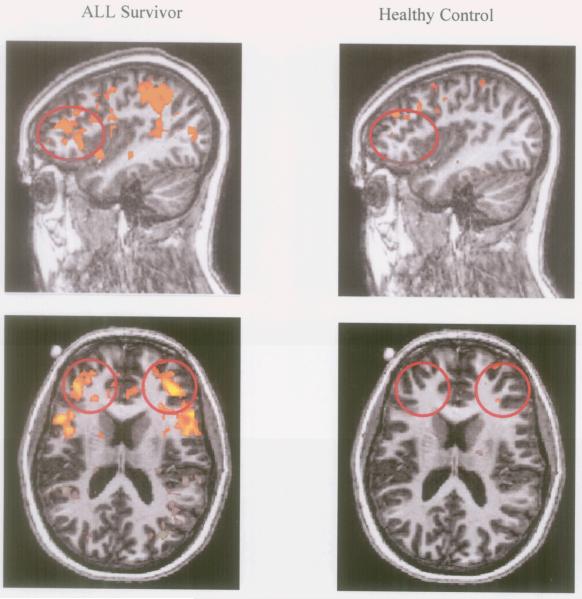
Figure 1.
Between Group Differences in DLPFC Activation on the 2 vs. 0 N-back Contrast During Neuroimaging. Differences in activation in the 2-back versus 0-back conditions for survivors of ALL (left column) and control subjects (right column). Yellow-to-orange clusters indicate areas of significantly greater activation in the 2-back condition relative to the 0-back conditions. Red circles identify the bilateral region of interest (right and left DLPFC).

