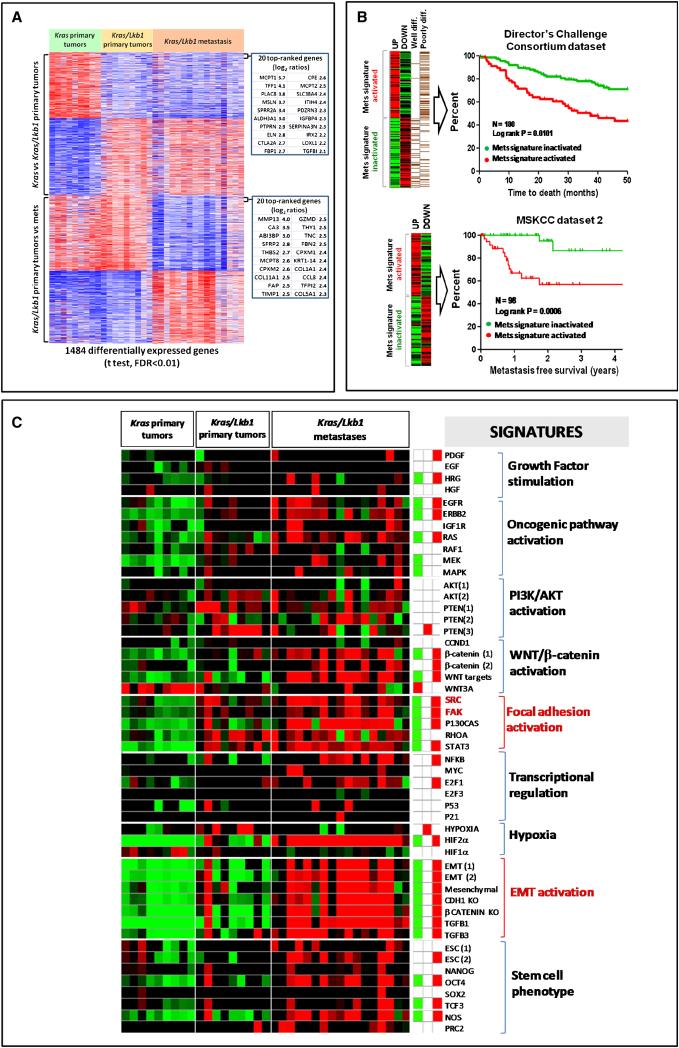
Figure 1. A gene expression signature of metastasis derived from a Kras-driven, Lkb1-deficient mouse lung cancer model predicts survival in human NSCLC.
A. Generation of an expression signature of metastasis. Kras/Lkb1 primary tumors were compared to Kras/Lkb1 metastases using two-class unpaired differential expression analysis and a false discovery rate (FDR) of <0.01. A total of 757 unique transcripts were significantly differentially deregulated and used to define a metastatic gene signature (Mets).
B. Kaplan-Meier analysis of the Director's Challenge Consortium dataset (N=180) and Memorial Sloan Kettering Cancer Center dataset 2 (N=98) of human lung tumors comparing the overall survival between tumors showing activation (red line) or inactivation (green line) of our mouse derived Mets signature. Red line = Mets signature activated. Green line = Mets signature inactivated.
C. Heat map of relative enrichment scores derived by gene set enrichment analysis. Tumors are represented in columns and genes signatures are represented in rows (red = significant enrichment of overexpressed genes; green, significant enrichment of under-expressed genes; black, not significant; p<0.05). The right panel shows the aggregate enrichment scores for each of the three classes of tumors (Kras, Kras/Lkb1 primary tumors and Kras/Lkb1 metastases).
See also Table S1 and Figure S1.

