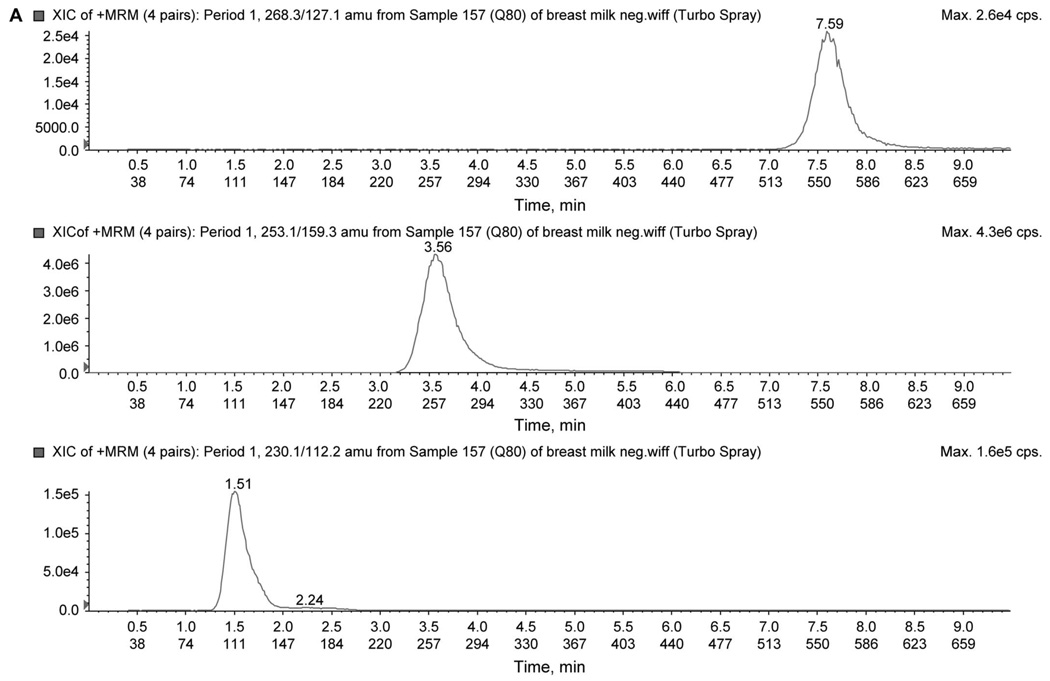
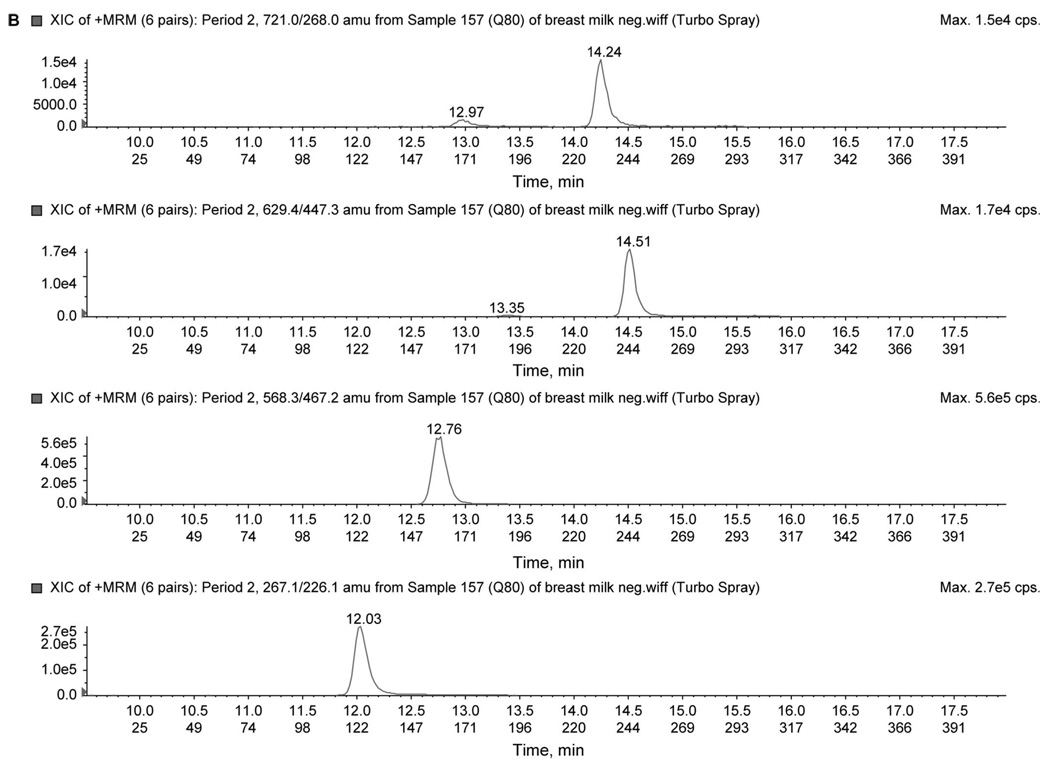
FIGURE 2.
A, Chromatogram of low QC (80 ng/mL) in positive-mode first period. The figure illustrates peaks for ZDV (268.3/127.1), CMI (253.1/159.3), and 3TC (230.13/112.2) ion pair. B, Chromatogram of low QC (80 ng/mL) in positive-mode second period. The figure illustrates peaks for RTV (721.0/268.0), LPV (629.4/447.3), NFV (568.3/467.2), and NVP (267.1/226.1) ion pair.


