
Figure 2. Ribo-proteomic analysis of in vivo captured RNPs identifies discrete subunits of the SMN complex that accumulate upon protein synthesis inhibition.
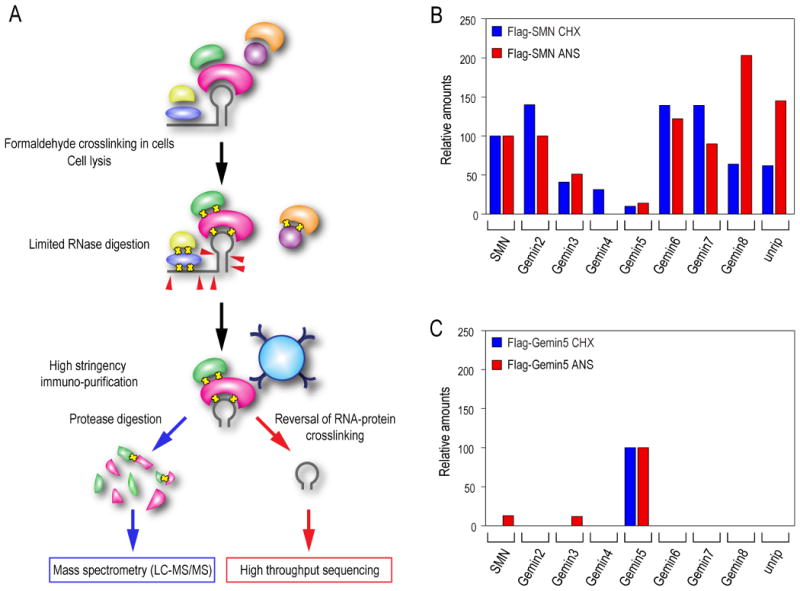
(A) An experimental strategy for in vivo capture of RNPs and their complete proteomic and RNA analysis by mass spectrometry and high throughput sequencing, respectively.
(B) Proteomic analysis of the SMN complex was performed before or after protein synthesis inhibition. The complex was purified from a FLAG-SMN expressing stable cell line and analyzed by LC-MS/MS mass spectrometry. The amount of each protein in the sample is expressed by its emPAI value and relative amounts of each component of the SMN complex associated with SMN were calculated by the ratio of their emPAI values (see also Table S1). The relative amounts are expressed as a percentage relative to its DMSO control that is normalized to 100%.
(C) Proteomic analysis of the Gemin5 subunit was performed as described in (A). The protein complex was purified from a FLAG-Gemin5 expressing stable cell line (see also Table S1).