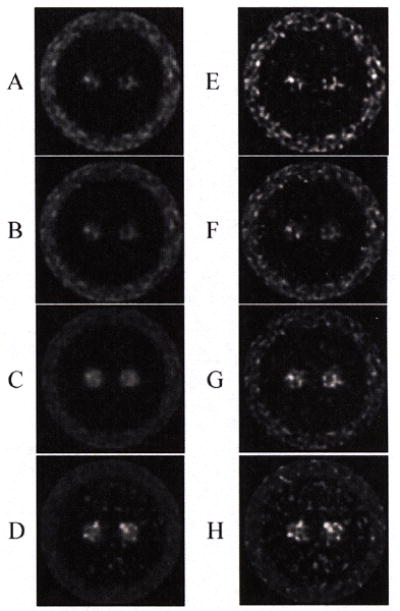
Fig. 4.

The results of two methods after 30 (left side: A, B, C and D) and 60 sub-iterations (left side: E, F, G and H). A. K1 image (0~2) for 4D B. K1 image (0~2) for frame-based method, C. VT mean image (0~30) for 4D, D. VT mean image (0~30) for frame-based method, E. K1 image (0~2) for 4D F. K1 image (0~2) for frame-based method, G. VT mean image (0~30) for 4D, H. VT mean image (0~30) for frame-based method.
