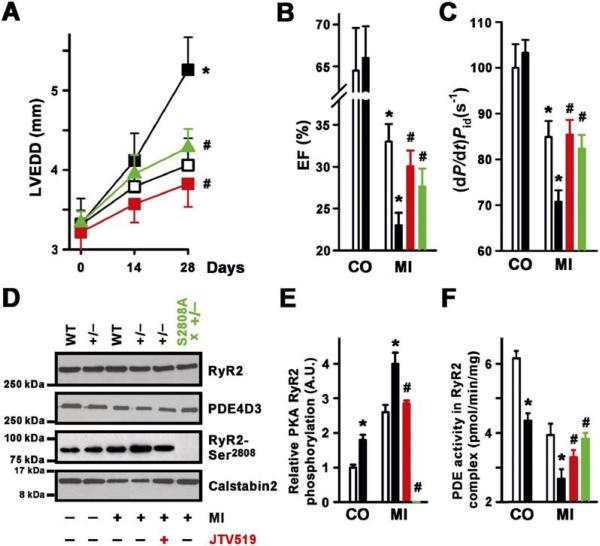
Figure 7. PDE4D3 Deficiency Promotes HF Progression.
(A) LVEDD increased in PDE4D+/− (black squares) compared to wt (open squares) mice before (control, CO) and 14 and 28 days after myocardial infarction (MI) (*p < 0.05 versus wt). Both treatment with the 1,4-benzothiazepine JTV-519 (red line), which enhances calstabin2 binding to RyR2, or crossing the PDE4D+/− mice with RyR2-S2808A mice that harbor RyR2 that cannot be PKA phosphorylated (green line) significantly reduced the remodeling of the left ventricle following MI (#p < 0.01 versus PDE4D+/−). Data in (A)–(C) are mean ± SEM. (B) Reduced cardiac EF in PDE4D+/− mice 28 days after MI. wt, open bars; PDE4D+/− mice, filled bars (*p < 0.05 versus CO same genotype). Both treatment with the 1,4-benzothiazepine JTV-519 (red bar), which enhances calstabin2 binding to RyR2, or crossing the PDE4D+/− mice with RyR2-S2808A mice that harbor RyR2 that cannot be PKA phosphorylated (green bar) significantly improved left ventricular EF following MI (#p < 0.01 versus PDE4D+/− MI).
(C) Left ventricular contractility (dP/dt)/Pid normalized to 100% of control in wt (open bars) and haploinsufficient PDE4D+/− mice (black bars) before (control, CO) and 28 days after MI (*p < 0.05 versus CO in same genotype). Treatment with JTV-519 (red bar) or crossing the PDE4D+/− mice with RyR2-S2808A mice (green bar) significantly improved contractility following MI (#p < 0.01 versus PDE4D+/− MI).
(D) Immunoblot showing levels of PDE4D3, calstabin2, and RyR2-Ser2808 PKA phosphorylation in the immunoprecipitated RyR2-channel complex. JTV-519 treatment (red) or crossing the PDE4D+/− mice with RyR2-S2808A mice (green) significantly increased the binding of calstabin2 to RyR2 in the PDE4D-deficient mice.
(E) Quantification of RyR2 PKA phosphorylation in wt and PDE4D+/− mice before (CO) and 28 days after MI, showing significantly more RyR2 PKA hyperphosphorylation in PDE4D+/− mice (*p < 0.05 versus wt at same time point). Treatment with JTV-519 (red bar) or crossing the PDE4D+/− mice with RyR2-S2808A mice (green bar) significantly reduced RyR2 PKA phosphorylation following MI (#p < 0.01 versus PDE4D+/− MI). Data in (E) and (F) are mean ± SD.
(F) Quantification of RyR2-associated PDE activity showing significant decrease in PDE4D+/− mice 28 days before (CO) and after MI compared to wt (*p < 0.05 versus wt). Treatment with JTV-519 (red bar) or crossing the PDE4D+/− mice with RyR2-S2808A mice (green bar) significantly increased RyR2-associated PDE activity following MI (#p < 0.01 versus PDE4D+/− MI).

