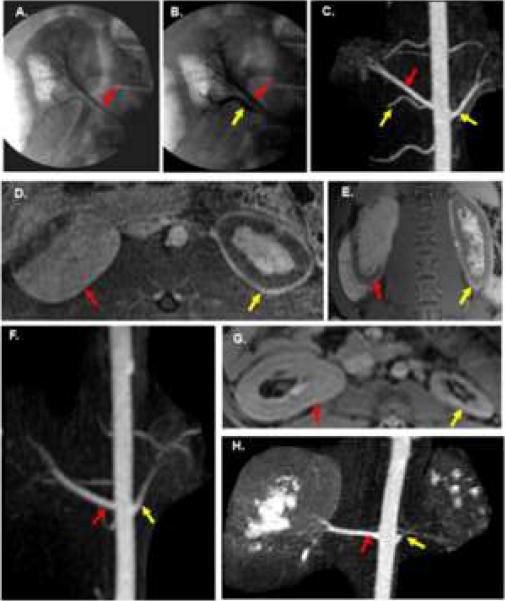
Fig. 1.
Angiographic and MRI findings of renal artery embolization. A–E are from the same animal. A. Pre embolization angiogram of right kidney shows right upper pole artery (red arrow). B. Post embolization angiogram of lower pole (yellow arrow) artery with normal upper pole artery (red arrow). C–E. MRI of the kidneys 3 days after embolization. C. Subvolume maximum intensity projection image from contrast-enhanced 3D MRA with embolized arteries (yellow arrow) and normal upper pole artery (red arrow) of the remnant kidney. D. Axial contrast-enhanced fat-saturated 3D spoiled gradient echo image showing largely intact upper pole of the right kidney (red arrow). Notice the rim of devascularization in the anterior lateral aspect of the remnant kidney. The total nephrectomy (yellow arrow) demonstrates extensive devascularization with only a thin rim of peripheral enhancement and some central enhancement. E. Coronal contrast-enhanced fat-saturated 2D SPGR image showing similar findings. Red arrow is remnant (right) kidney and yellow arrow is the total nephrectomy (left). F. Coronal subvolume MIP image from CE 3D MRA on a day 14 animal with an enlarged renal artery (red arrow) supplying the remnant kidney and a smaller renal artery (yellow arrow) supplying the total nephrectomy. G–H are day 28 images from the same animal. G. Axial post-contrast 2D SPGR image shows hypertrophy of the remnant kidney (red arrow) and extensive atrophy of the total nephrectomy (yellow arrow). H. MIP image from a 3D CE MRA shows continued enlargement of the renal artery (red arrow) supplying the remnant kidney while the renal artery (yellow arrow) supplying the total nephrectomy has narrowed considerably.

