
Figure 1.
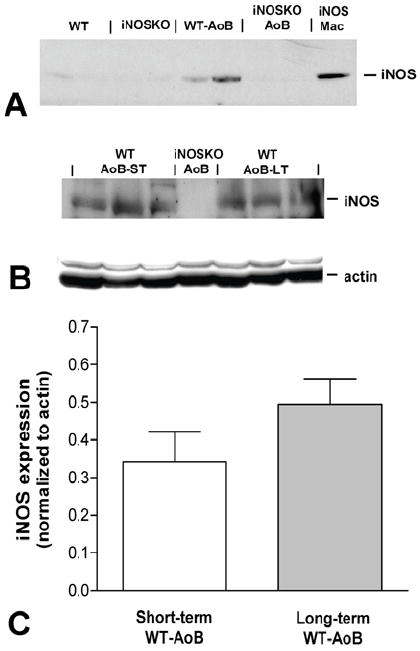
Western blots for iNOS expression in hearts from WT and iNOSKO mice after long-term AoB (panel A) and age-matched controls. Panel B shows the expression of iNOS and actin in short-term (ST) and long-term (LT) WT-AoB mice. A long-term iNOSKO-AoB was used as a negative control. Panel C represents the average iNOS expression normalized to actin expression in short-term (n=6) and long-term (n=6) WT-AoB mice. iNOS; Mac-purified iNOS from activated murine macrophage cells.