
Figure 5.
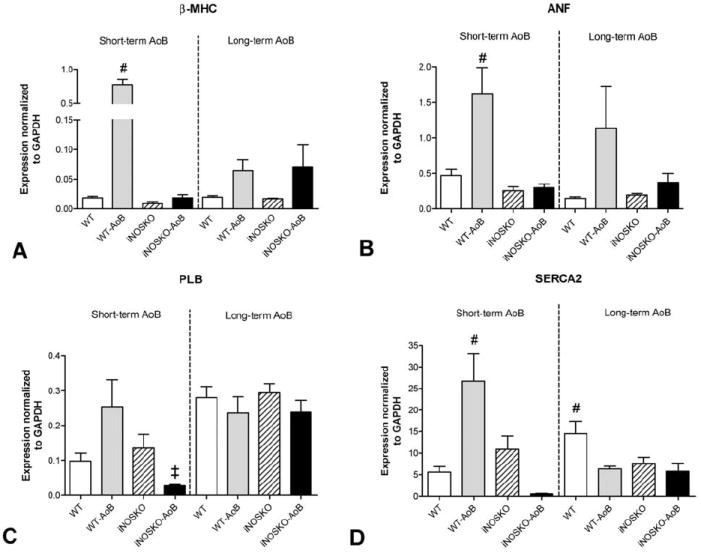
Quantitative gene expression (RT-PCR) in short- and long-term WT-AoB, iNOSKO-AoB and age-matched control mice. A) beta-myosin heavy chain (beta-MHC). B) Atrial natriuretic factor (ANF). C) Phospholamban (PLB). D) Sarcoplasmic reticulum Ca ATP-ase (SERCA2a). Expression was normalized to GAPDH expression (n=3-4). #Significantly different (P<0.05) compared to all other groups within short- or long-term AoB groups; ‡Significantly different (P<0.05) compared to WT-AoB within short- or long-term AoB groups.