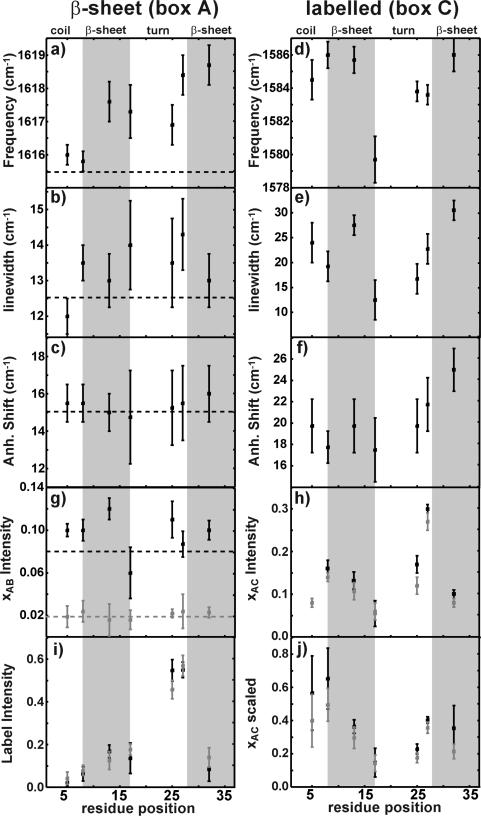
Figure 4.
Parameters extracted from the 2D IR spectra. The frequencies, inhomogeneous linewidths, and anharmonicities are plotted for the unlabeled β-sheet feature (a–c) and the isotope labeled feature (d–f). The normalized xAB and xAC cross-peak intensities are plotted in parts g and h for both perpendicular (black) and parallel (gray) spectra. Label intensities and the xAC cross-peak scaled to the geometric mean of its parent features are plotted in parts h and i. Gray boxes designate regions of β-sheet structure as determined by ssNMR.

