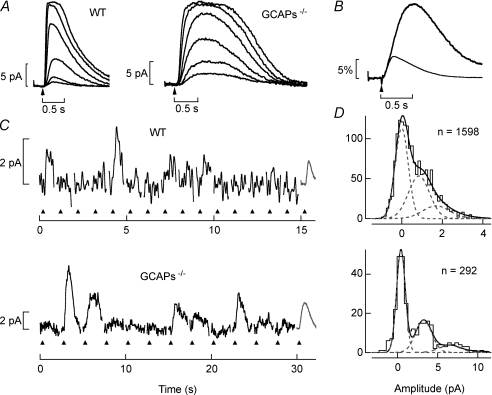
Figure 1. Light-evoked responses of WT and GCAPs−/− rod photoreceptors.
A, response families to 30 ms flashes (arrow) WT and GCAPs−/− rods. Flash strengths for the WT rod yielded 0.43, 1.4, 4.1, 19, 58 and 180 Rh*, and for the GCAPs−/− rod yielded 0.34, 0.76, 1.9, 4.0, 8.3 and 15 Rh*. B, derived single-photon responses from WT and GCAPs−/− rods plotted as a fractional suppression of the dark current versus time. The WT response was derived from 2137 trials across 9 cells. The GCAPs−/− response was derived from 4280 trials across 23 cells. The effective number of cells was estimated from the total number of trials divided by the number of trials on the cell with the most, and thus can be non-integer. The time-to-peak of the single-photon response was 208 ± 11 ms (n= 4.1) in WT rods and 503 ± 39 ms (n= 18.4) in GCAPs−/− rods (mean ±s.e.m.). The integration time of the averaged response was 540 ms for WT rods and 900 ms for GCAPs−/− rods. C, individual trials to flashes of fixed strength in WT and GCAPs−/− rods. In each epoch a flash was delivered (up triangle) at 0.2 s and on average generated 0.9 Rh* in WT rods, and 1.7 Rh* in GCAPs−/− rods. The average single-photon response was shown as the right-most epoch (grey) for comparison. D, the SNRs for WT and GCAPs−/− rods were determined from the fits of histograms to the data in C (see Methods for details). Note the difference in the abscissa for WT and GCAPs−/− rods.

