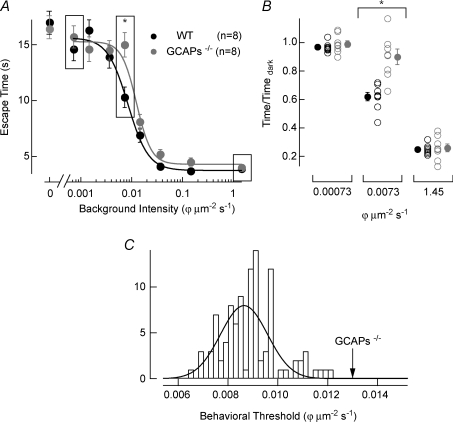
Figure 2. Behavioural estimate of absolute visual threshold in WT and GCAPs−/− mice.
A, escape time from the maze plotted versus light intensity in equivalent photons at the peak absorption wavelength of mouse rhodopsin (501 nm; see Methods), with total darkness plotted at an intensity of 0 ϕμm−2 s−1. Mean ±s.e.m. at each intensity are plotted for WT mice (n= 8; black symbols) and GCAPs−/− mice (n= 8; grey symbols). The mean and the standard error are collectively best fit with a Hill equation where the parameters were allowed to vary. In WT mice the Hill parameters were I1/2= 0.0085 ϕμm−2 s−1 and n= 2.2, and in GCAPs−/− mice were I1/2= 0.013 ϕμm−2 s−1 and n= 2.9. B, differences in escape behaviour were more pronounced near behavioural threshold which occurs in the transition from high light levels where mice can see the target and escape quickly, to low light levels where mice cannot see the target and search randomly. To facilitate the comparison of escape times at these light levels the normalized time to escape on a mouse-by-mouse basis is plotted at 0.00073 (low), 0.0073 (transition) and 1.45 (high) photons μm−2 s−1, as indicated by the boxes in A. At the transition background light level of 0.0073 photons μm−2 s−1 the difference in escape times was statistically significant between WT and GCAPs−/− mice, P= 0.001 *Student t test P < 0.01. C, the probability that the behavioural data collected from GCAPs−/− mice could be explained by the WT data was estimated by bootstrapping (see Methods). A histogram plotting I1/2 values from 100 sets of WT behavioural curves generated by sampling with replacement is shown. The histogram was fitted with a Gaussian distribution that has a mean of 0.0086 photons μm−2 s−1 and a standard deviation of 0.0013 photons μm−2 s−1. The best-fit I1/2 for the GCAPs−/− behavioural data has a value of 0.013 photons μm−2 s−1, 3.4 standard deviations above the WT data mean. This reflects a probability that the GCAPs−/− behavioural data could be explained by the WT data of P < 0.005.

