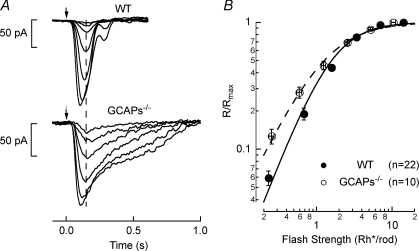
Figure 3. Flash response families in WT and GCAPs−/− rod bipolar cells.
A, light-evoked responses to 10 ms flashes (arrow) for voltage-clamped (Vm=−60 mV) rod bipolar cells. For the WT rod bipolar cell flash strengths were 0.084, 0.25, 0.59, 1.3, 2.6, 5.3 and 11 Rh*/rod, and for the GCAPs−/− rod bipolar cell flash strengths were 0.084, 0.25, 0.59, 1.3, 2.6, 5.3 Rh*/rod. A vertical dashed line demonstrates the initial time to peak of the rod bipolar responses are similar between WT (145 ± 7.7 ms, n= 8.2) and GCAPs−/− (169 ± 19 ms, n= 5.8) rod bipolar cells (mean ±s.e.m.) despite the slowed response of GCAPs−/− rods (see Fig. 1). B, average response–intensity relationship across all WT (n= 22) and GCAPs−/− (n= 10) rod bipolar cells. Data were fitted will a Hill equation with n= 1.55 and I1/2= 1.8 Rh*/rod for WT rod bipolar cells, and n= 1.25 and I1/2= 1.3 Rh*/rod for GCAPs−/− rod bipolar cells.

