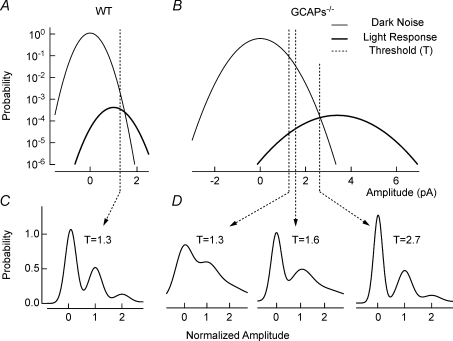
Figure 6. Model for the non-linear threshold at the rod-to-rod bipolar synapse.
A, the probability density of dark noise and single-photon (light) response amplitude in WT is plotted for conditions near absolute visual threshold (∼0.0005 Rh*). Standard deviations for Gaussian distributions were averaged and have been normalized to the mean single-photon response amplitude for WT rods ( ,
,  ). The dashed vertical lines indicate the position of the non-linear threshold, plotted at 1.3 for WT (Field & Rieke, 2002b). B, the probability density for GCAPs−/− rods near absolute visual threshold, as for WT rods. Gaussian distributions were averaged and have been normalized to the mean single-photon response amplitude (
 ,
,  ) that were multiplied by 3.4-fold difference in the mean single-photon response amplitude compared to WT rods (see Fig. 1). Non-linear thresholds were plotted at 1.3 (same as WT), 1.6 and 2.7 pA. C and D, rod bipolar response distributions were simulated assuming the convergence of 20 rods per rod bipolar cell and flash strengths of 0.1 Rh*/rod and 0.04 Rh*/rod for WT and GCAPs−/− distributions, respectively. We assumed a sharp threshold, where responses exceeding the threshold were transmitted and those below the threshold were scaled by 0.15, to reproduce the observed variance in dark noise of the rod bipolar cells in Fig. 4. Simulated histograms resulting from 10,000 repeated flashes were fitted as the sum of Gaussian distributions centred at the absorption of 0, 1, 2 … photons (see Methods), and the response amplitude axis was normalized to the mean single-photon response amplitude.

