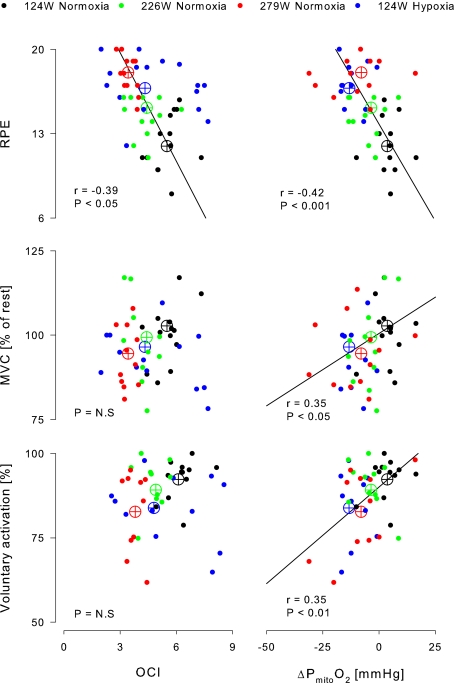
Figure 2.
Relation between measurements of fatigue (y-axis) and cerebral metabolism and oxygenation (x-axis) Data are individual and mean (open symbols) for 16 subjects (filled circles) and the four colours illustrates exercise in normoxia at 124 (black), 226 (green) and 279 W (red) and in hypoxia at 124 W (blue). The regression lines are computed according to the mean values. OCI, cerebral oxygen/carbohydrate index; Δ , changes in cerebral mitochondrial oxygen tension; RPE, ratings of perceived exertion; MVC, maximal voluntary contraction.

