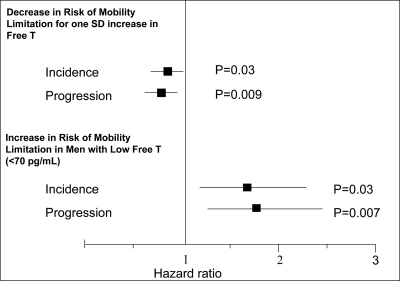
Figure 2.
Longitudinal analyses of incident mobility limitation. Continuous FT level hazard ratios are for 1 sd increase in hormone levels, adjusting for age, BMI, smoking, and comorbidities (cardiovascular disease and cancer). As shown in the upper panel, each sd increase in FT level was associated with 22% (OR = 0.78; 95% CI = 0.62–0.97) decrease in the risk of developing mobility limitation and 25% decrease in the risk of worsening mobility limitation (progression). The lower panel shows the association of low FT (<2.5th percentile (<70.0 pg/ml)) at baseline examination 7 with the risk of developing (incident) mobility limitation at examination 8 or of reporting worsening mobility limitation (progression) at examination 8. The FT hazard ratios were adjusted for age, BMI, smoking, and comorbidities. The squares indicate point estimates for hormones, and the lines indicate 95% CI.

