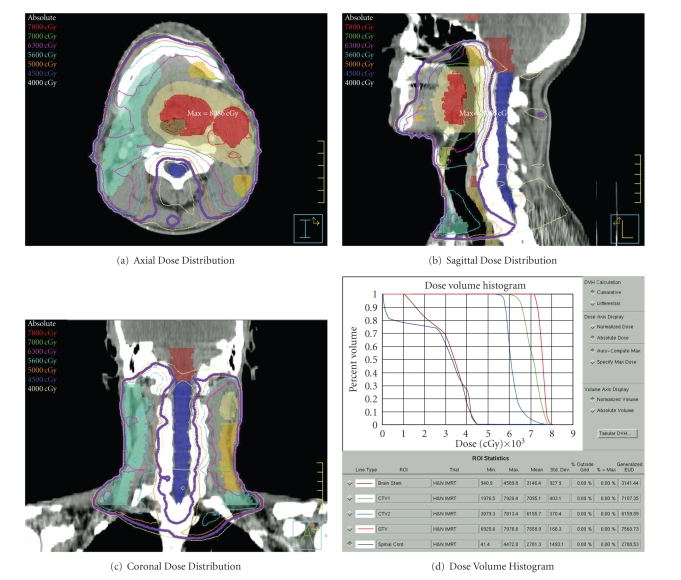
Figure 1.
Radiation dose distribution as represented by radiation isodose lines displayed in the (a) axial, (b) sagittal, and (c) coronal planes. The thick purple line represents the 4500 cGy isodose line. The dose volume histogram (d) graphs the percent volume of structure or target receiving a radiation dose. Radiation targets including the red gross tumor volume (GTV), the beige expansion of GTV (CTV1), the yellow high-risk clinical volume (CTV2), and light blue low-risk clinical volume (CTV3) are included with the critical normal structures of spinal cord and brainstem.

