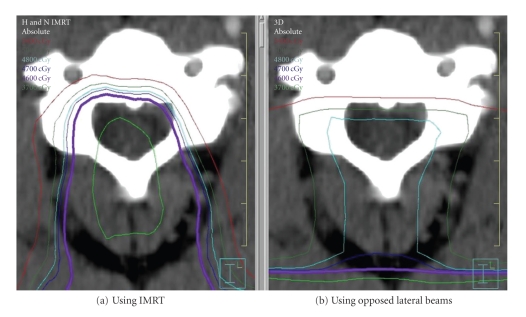
Figure 2.
Radiation dose distribution represented by radiation isodose lines through an axial plane of the cervical spinal cord. (a) Dose distribution with IMRT and (b) dose distribution using a non-IMRT plan using opposed lateral beams. The light blue line represents the 4800 cGy isodose line and the purple line represents the 4500 cGy isodose line.

