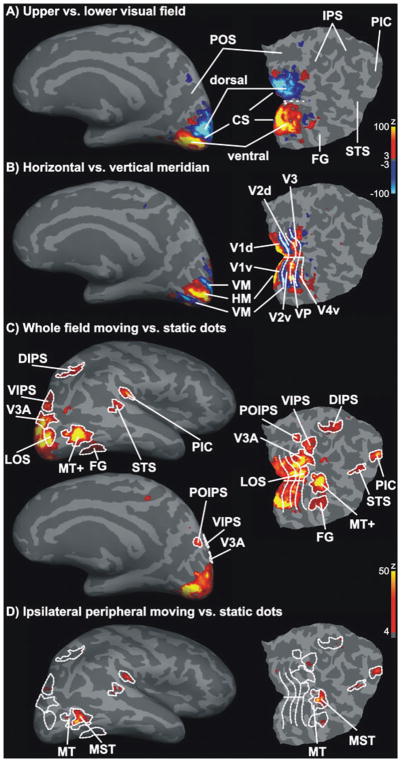
Fig. 3.
Definition of ROIs. Statistical parametric maps for the ROI definition localizer runs are shown for one representative hemisphere. Activity maps were overlaid on the inflated gray matter surface and a flat occipital patch that was cut along the calcarine sulcus (CS). False positives were reduced by adjusting significance maps by a false-discovery rate of 0.001. Significance maps were spatially smoothed for illustration only. (A) Representations of the lower (blue) and upper (yellow–red) visual field demarcated dorsal (d) and ventral (v) parts of early visual areas. (B) Horizontal (HM, yellow-red) and vertical (VM, blue) meridian respresentations separated early visual areas (V1d/v, V2d/v, V3, VP and V4v). (C) Statistical parametric maps for high-contrast radially moving vs. static dots were used to define motion-sensitive areas MT+, LOS, V3A, VIPS and DIPS, POIPS, FG (motion-sensitive fusiform gyrus), STS and PIC. (D) The MT+ was further subdivided into MT and MST. MST was defined as the region of MT+ that responded to visual motion in the peripheral ipsilateral visual field (Dukelow et al., 2001; Huk et al., 2002).

