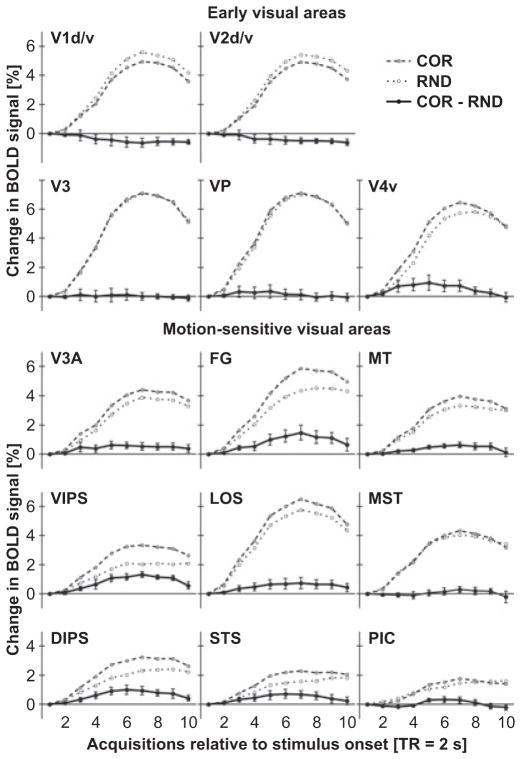
Fig. 4.
Mean BOLD signal changes to COR and RND epochs for each ROI. The time course of the BOLD signal (percentage signal change) was calculated using the general linear model using a finite impulse response function to model ten acquisitions (TRs). The time window extended from the onset of the 16-s stimulation epoch to 4 s after the end of the epoch. Baseline differences at stimulation onset (first TR) were corrected. Signals for both COR and VOL stimulation epochs were contrasted with fixation epochs. The solid line depicts the difference COR minus VOL. Error bars reflect SEMs across subjects. Note that differences in the BOLD signal were most evident between the fourth and eighth acquisition. ROI labels as above (see Fig. 3 or Table 1).

