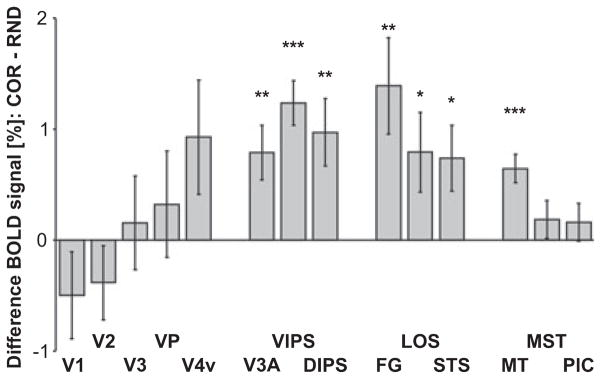
Fig. 5.
Mean difference in the BOLD signal of COR minus VOL for each ROI. BOLD signals reflect the mean signal (percentage signal change) for the period from the fourth to the eighth acquisition after epoch onset (see Fig. 4). Error bars reflect SEMs across subjects. Note that stronger BOLD signals were observed for COR than for VOL stimuli in motion-sensitive regions V3A, VIPS, DIPS, FG, LOS, STS and MT. ROI labels as above (see Fig. 3 or Table 1). ***P < 0.001, **P < 0.01, *P < 0.05.

