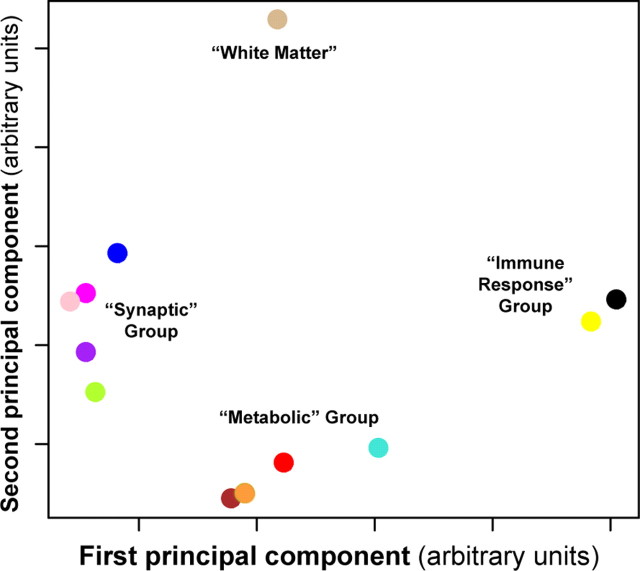
Figure 2.
Multidimensional scaling (MDS) plot of top two PCs of each module reveals clear functional groupings. The first two PCs of each module in the unsupervised AD analysis, PC1 (x-axis) and PC2 (y-axis), were plotted against one another as a quantitative measure of module similarity, using the same scaling for both axes. Each colored point corresponds to a module presented in Figure 1, using the same color depiction. The modules cluster into four distinct groups that can be functionally annotated using the EASE categories from Table 1, resulting in the following descriptive group titles: the “synaptic” group (blue, magenta, pink, purple, green yellow), the “metabolic” group (brown, green, turquoise, red), and the “immune response” group (yellow, black). The first PC of each module in the “synaptic” and “metabolic” groups correlates with MMSE score, whereas the first PC of the red module is also correlated with NFT burden.

