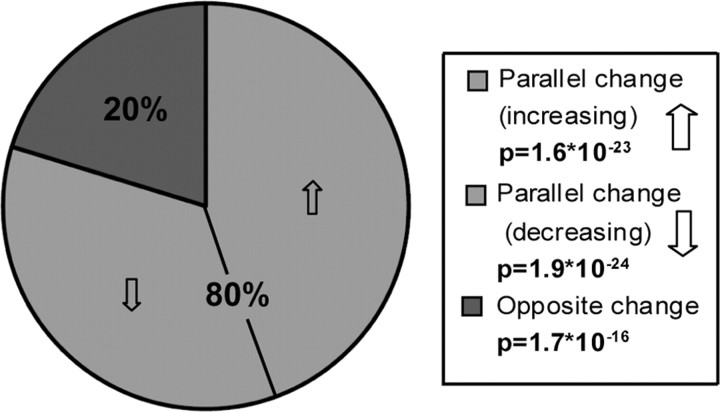
Figure 7.
Overlapping genes in AD and aging show parallel changes. Among genes with probe sets that are present in both studies, there are more genes significantly correlated with both AD and aging (∼48% of possible overlapping genes) than expected by chance (590 vs 526; p = 4 × 10⁻⁴), and most of these genes increase or decrease with both AD and aging. Both the over-representation of genes with parallel changes (p < 10−22) and the under-representation of genes with opposite changes (p < 10−15) are highly significant. p values were obtained using a hypergeometric distribution (for a list of these genes, see supplemental Table 6, available at www.jneurosci.org as supplemental material).

