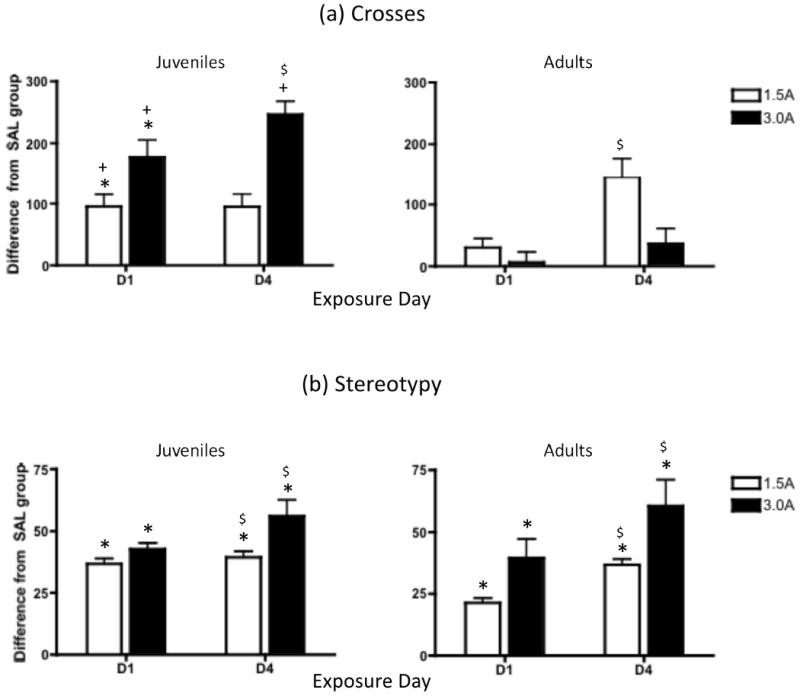
Figure 2.

(a) Number of crosses and (b) stereotypy exhibited during the final 40 minutes of a 60-min observation period in juveniles and adults given saline, 1.5 mg/kg amphetamine (1.5A), or 3.0 mg/kg amphetamine (3.0A) on the first (D1) and fourth (D4) day of amphetamine exposure. Data are expressed as the mean difference score from the saline group at each age, with bars representing standard error of the mean. Asterisks (*) indicate a significant difference from the saline controls (p ≤ .05); Plus signs (+) denote a significant age difference within exposure condition and day; dollar signs ($) signify a significant increase from day 1 to day 4 of drug exposure within a particular age and dose condition. For figure (b), asterisks and dollar signs denote significant changes, collapsed across age group.
