Figure 3.

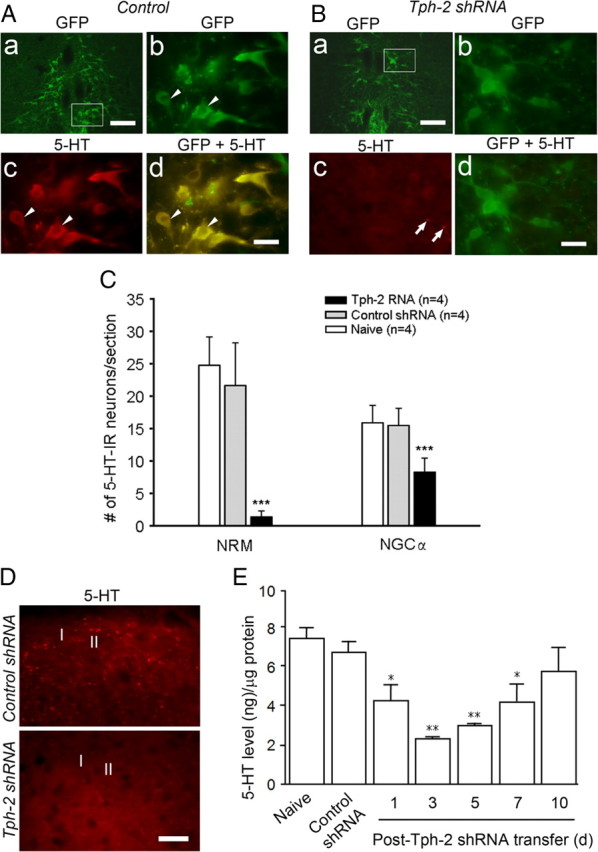
5-HT expression and decrease in GFP-expressing RVM cells and the spinal dorsal horn. A, GFP expression in the NRM, a medial area of the RVM, at 3 d after control gene transfer (Aa). High magnification of images from the inset in Aa shows GFP expression (Ab) and 5-HT immunoreactivity (Ac) in NRM neurons (arrowheads). Normal 5-HT immunoreactivity is present in GFP-expressing neurons (arrowheads, Ad). B, GFP-expressing neurons in the NRM at 3 d after transfer of plasmid of Tph-2 shRNA (Ba). High magnification of images from the inset in Ba shows GFP expression in NRM neurons (Bb) and sparse 5-HT-immunoreactive profiles (arrows) but not cell bodies in the NRM area (Bc). Double image indicates the loss of 5-HT immunostaining in GFP-expressing neurons in the RVM at 3 d after transfer of plasmid of Tph-2 shRNA (Bd). C, Summary data of the effect of shRNA transfer at 3 d on 5-HT immunoreactivity in the NRM and NGCα, a medial and a lateral area, respectively. Tph-2 shRNA significantly reduces 5-HT immunoreactivity in the RVM compared to control shRNA, especially in the NRM than the NGCα (n = 4 per group ***p < 0.001, vs control shRNA). D, Normal distribution and reduction of 5-HT-labeled fibers in superficial spinal cord (lamina I and II) at 3 d after control (top) or Tph-2 shRNA (bottom panel) treatment. E, ELISA showing time course-dependent decrease of tissue 5-HT concentration in spinal dorsal horn after gene transfer [n = 3, *p < 0.05; **p < 0.01, vs control shRNA (n = 3)]. Scale bars: 200 μm (Aa, Ba), 50 μm (Ab–Ad, Bb–Bd), 20 μm (D).
