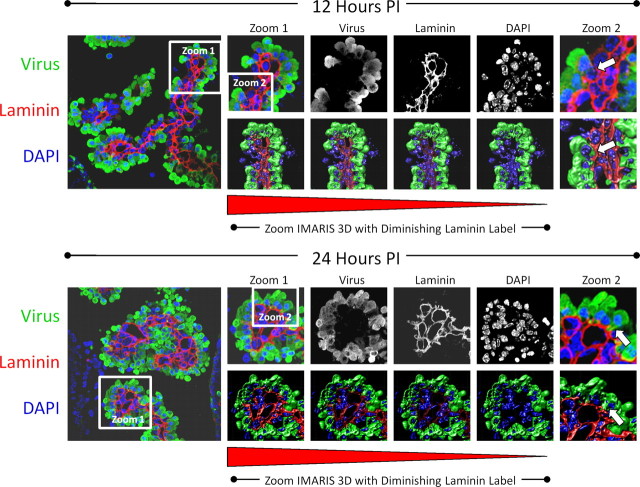
Figure 3.
Progressive extravasation of infected myeloid cells through the basement membrane as determined by confocal microscopy and Imaris 3D analysis. Neonatal mice were infected (intracranially) with eGFP-CVB3, and the brains were harvested 12 and 24 h PI. The kinetics of myeloid cell migration through the basement membrane (outlined by laminin staining in red) was observed by confocal microscopy and IMARIS 3D analysis at 12 h (top) and 24 h PI (bottom). Low magnification of immunofluorescence images showed infected myeloid cell migration (green) through the tight junctions of the choroid plexus epithelium. Gray-scale images of all three colors (virus, green; laminin, red, DAPI, blue) at 12 and 24 h PI revealed the intensity and organization of the myeloid cell infiltration in greater detail. To better visualize myeloid cell entry, IMARIS 3D with diminishing laminin label (diminishing red) was performed on a higher magnification (zoom 1) for both 12 and 24 h PI images. Higher magnification of zoom 1 revealed the extravasation of infected myeloid cells through the basement membrane (zoom 2, white arrows). Original images were obtained with a 63× Plan-Aprochromat objective at 0.3 mm interval step slices (as described in Materials and Methods).

