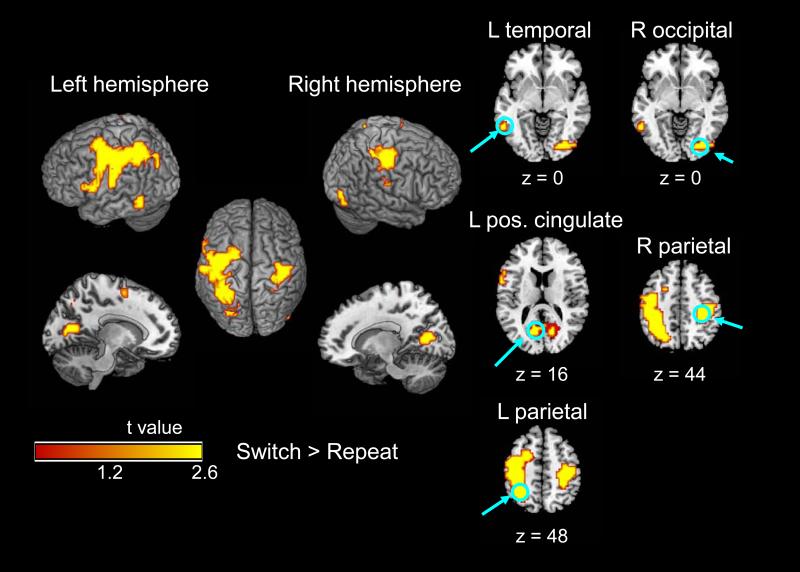
Figure 4.
Event-related activation for switch > repeat on the cue+target trials (cue-related activation subtracted), within the omnibus map (Table 3). No age group difference was significant for the switch > repeat contrast. Individual slices represent local maxima of the switch > repeat contrast for both age groups combined (Table 3, bold values).

