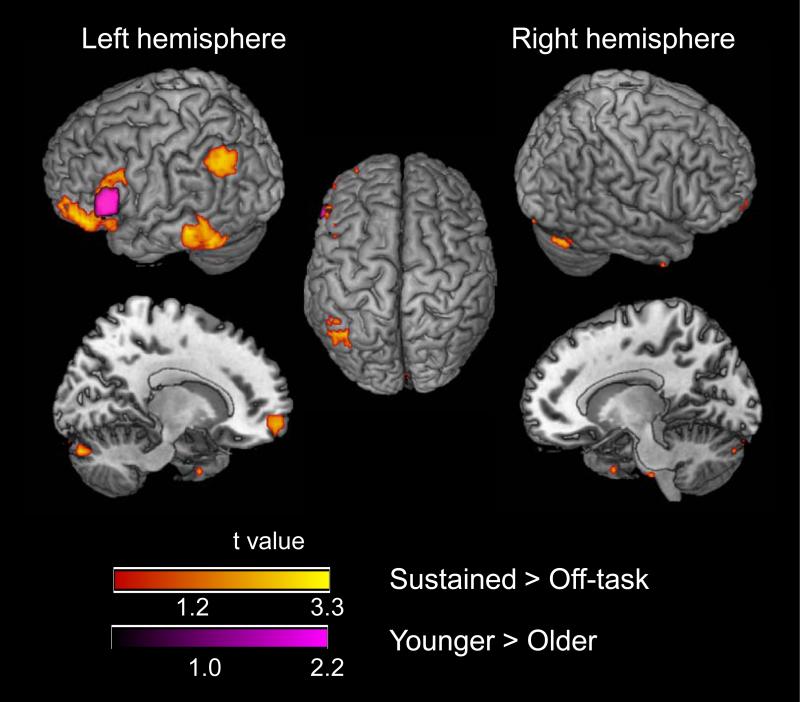
Figure 5.
Sustained activation during the on-task periods, relative to the off-task periods (see Materials and Methods). The red-yellow color scale represents active voxels for both age groups combined. The purple color scale represents greater activation for younger adults than for older adults (Table 4). No activation was significantly greater for older adults than for younger adults.

