Abstract
The low water-solubility of gliclazide (GL) leads to a low dissolution rate and variable bioavailability. The aim of this study was to investigate the effect of micronization on the absorption and pharmacokinetics of GL after oral administration in rats. GL microcrystals were prepared using solvent-change and pH-shift methods. Scanning electron microscopy showed considerable changes in the shape and size of crystals using both methods. In the optimized formulation of each method, the particle size of treated GL was reduced about 30 (from 290 to 9.9 μm) and 61 times (to 4.76 μm) by solvent-change and pH-shift methods, respectively. Recrystallized samples showed faster dissolution rate than untreated GL particles. Glucose-lowering effect, Cmax, and area under the drug concentration-time profile (area under the curve (AUC)) were compared in diabetic and normal rats. AUC and Cmax were increased by microcrystals in both groups of animals. Administration of 40 mg/kg of GL in the form of untreated drug and microcrystals obtained by solvent-change and pH-shift methods caused 12.49% and 21.04% enhancement in glucose-lowering effect of GL in diabetic rats, respectively.
Key words: gliclazide, in situ micronization, microcrystals, pharmacokinetics
INTRODUCTION
Low solubility of drugs in water results in poor bioavailability because the solubility of a drug is an important factor in determining its absorption rate (1). According to the biopharmaceutics classification system (2), for class II drugs, the dissolution rate is the limiting factor for the drug absorption rate. An improvement in the dissolution rate of these drugs can increase the blood levels to a clinically suitable level. One way to enhance the dissolution rate is to reduce particle size, which increases the total surface area (3). Several methods of reducing particle size have been suggested. Physical methods such as milling and grinding (4) are successful in particle size reduction; however, the particle size uniformity is not achieved. A common particle size reduction method for hydrophobic drugs is microcrystallization (5). The process is usually used to obtain small particles of the disruption of large crystals. Chaumeil describes the improvement in dissolution rate and in bioavailability by micronization of sparingly water-soluble drugs using jar mills and fluid energy mills (6). In situ micronization and microcrystallization are suitable methods for the production of micron-sized drugs (5–7). Compared with milled products, drug properties are optimized, the particle size is more uniformly distributed, and the powder is less cohesive (5–13). Gliclazide (GL), 3-(7-azabicyclo [3.3.0] oct-7-yl)-1-(4-methylphenyl)sulfonylurea is a second-generation sulfonylurea, widely used for the treatment of non-insulin-dependent diabetes mellitus. It has a low solubility in water (55 mg/L) and gastric fluids, a common characteristic of this group (14) which determines a low dissolution rate and hence inter-individual variability on its bioavailability (15,16). To enhance the dissolution rate of this drug complexation of GL with beta-cyclodextrin in the presence of hydroxypropylmethylcellulose (HPMC) has enhanced its dissolution 2.5-fold (17,18). Partially methylated beta-cyclodextrin has been also used for this purpose, and the results indicate that it could be useful for the solid GL formulations as it may result in a more rapid and uniform release of the drug. Experimental evidence of the complexation between drug and methylated cyclodextrin was reported for the co-ground and spray-dried systems (19). As discussed by Rasenak and Müller (7), in situ micronization by the presence of a stabilizing polymer covers the hydrophobic surfaces of the precipitated substances, and consequently, the steric hindrance caused by the polymer prevents the crystal growth. In this study, the oral absorption and pharmacokinetic parameters of microcrystals prepared by in situ micronization techniques based on solvent and pH-shift method were compared with each other and the untreated GL.
MATERIALS AND METHODS
Materials
Gliclazide and ibuprofen (used as internal standard) (IS) were purchased from CFM Co. (Italy) and Sekhasari Co. (India), respectively. HPMC from (Aldrich, UK) and Brij35 was obtained from Fluka (Germany). High-performance liquid chromatography (HPLC) grade of acetonitrile and methanol (Merck, Darmstadt, Germany) and double-distilled water were used throughout the analysis. All other chemicals and reagents were of analytical grade. Male Wistar rats were purchased from the animal house of Isfahan University of Medical Sciences. All the animals were cared for according to the rules and regulations of the Institutional Animal Ethics Committee (IAEC) guidelines of the Health Ministry, Iran.
Micronization
In preliminary studies, two different stabilizing agents (HPMC and Brij 35) with different concentrations of GL (0.5–1%) and stabilizers (0.1–0.05%) were studied by a full-factorial design to give the most stable microcrystals with the least particle size (20). Details of the preparation methods of microcrystals are reported previously (20,21). Briefly, in solvent-change method, 0.5 g of GL was dissolved in 30 ml of acetone. One hundred milliliters of water (as the non-solvent of GL) containing 0.05% of Brij35 (as stabilizer) was poured rapidly into the drug solution under stirring at 26,000 rpm by an ultra-homogenizer at ice bath temperature. A micron-sized dispersion was formed spontaneously. The mixture was allowed to be mixed for further 15 min, and then it was transferred to the vacuum oven at 40°C while stirring for 3 h. The aqueous suspension was freeze dried (20). In pH-shift method, 0.3% of GL was dissolved in an aqueous solution with pH 11 that contained 0.05% of Brij35, a stabilizing agent. The pH of the solution reached 5 by the addition of hydrochloric acid during 5 min in ice bath while stirring in 26,000 rpm (21).
Dissolution Studies
Dissolution rates of prepared microcrystals were studied by paddle method at 37°C, in 250 ml HCl 0.1 N containing 0.25% Tween 20 that was stirred at 100 rpm. Five milliliters of dissolution medium was withdrawn from the dissolution vessels at selected time intervals and analyzed for GL content at 230 nm spectrophotometerically (Shimadzu, Japan).
HPLC Method
A simple and rapid method was used to analyze GL in plasma by a high-performance liquid chromatographic method. The HPLC method was the modification of the previously published method by Rouini et al. (22). In the modified method reported previously by the authors (Varshosaz et al., under consideration for publication in Scientia Pharm), only 100 µl of plasma is required. Briefly, GL and ibuprofen (as internal standard) were extracted from a mixture of 100 µl of plasma, 100 µl of 0.07 M phosphate buffer (pH 4.5), and 100 µl of the internal standard working solution using 3 ml of toluene following by centrifugation for 15 min at 10,000 rpm (8,500×g) (Universal Hettich D7200 Tuttlingen, Germany). A 2,500-µl aliquot of the upper organic layer containing GL and IS was transferred to a clean glass tube and evaporated under air stream to dryness at 50°C. The residue was redissolved in 100 µl of mobile phase, and a 50-µl aliquot was injected into the HPLC column. The GL peak was separated from endogenous peaks on a C18 column by a mobile phase of acetonitrile/phosphate buffer pH 3.3 (65:35, v/v) and the flow rate was 1 ml/min. Waters 2487 Dual UV absorbance detector was used to detect GL at 230 nm.
Animal Studies
Male Wistar rats weighing 180–220 g housed in a light–dark cycle and temperature-controlled environment were used for in vivo studies. Food was withheld during the experiment and the night before. Water was accessed ad libitum.
Induction of Diabetes
Diabetes was induced in rats by an intraperitoneal injection of streptozotocin solution (16 mg/ml) (Zanosar, 45 mg/kg) in citrate buffer pH 4.5. The animals were diabetic 72 h after injection. Rats were considered diabetic and included in the study when fasted glycemia (by Glucose-SL Kit, Zeistchem, Iran) was higher than 300 mg/dl (23).
Dosing and Sampling
The study was performed on day 3 following streptozotocin injection after an overnight fasting. Forty-two diabetic and 30 normal rats were divided into seven and five groups, respectively (n = 6).
Different formulations were intragastrically administered to each group (n = 6) as suspended in normal saline by a feeding tube. Normal saline was preferred to any other vehicle because it did not make any change on blood glucose level.
Normal saline to diabetic and normal control group of rats.
Untreated GL (40 mg/kg) to diabetic and normal rats.
Twenty, 30, and 40 mg/kg of microcrystals of GL (D0.3B0.05) in pH-shift method to diabetic rats. Dose–response study of the prepared crystals was performed on only diabetic rats.
Microcrystals D0.5 B0.05 (40 mg/kg) in solvent-change method to diabetic and normal rats.
Insulin (2 IU/kg) to diabetic and normal rats.
At specified time intervals (15, 30, 45, 60, 90, 120, 240, 480, 720, and 1,440 min) 300-µl blood samples were taken by retro-orbital blood sampling (24) and collected in 0.5-ml micro-centrifuge tubes. About 180 µl plasma was obtained. One hundred microliters was used for GL concentration determination and 10 µl for glucose estimation. The samples were immediately centrifuged in 8,000 rpm for 15 min, and the plasma was collected, and glucose concentration was determined. The remaining plasma was frozen at −20°C for further analysis of GL.
Pharmacokinetic Parameters
Absorption rate constant (ka) and elimination rate constant (ke) were calculated using the Wagner–Nelson method (25) and the slope of elimination part of logarithmic concentration-time curve after oral absorption, respectively. The area under the curve (AUC) of plasma GL concentration-time profile was calculated by linear trapezoidal method.
Data Analysis
In order to compare the results, ANOVA and Student’s t test (SPSS program; version 12.0) were used.
RESULTS
Micronization
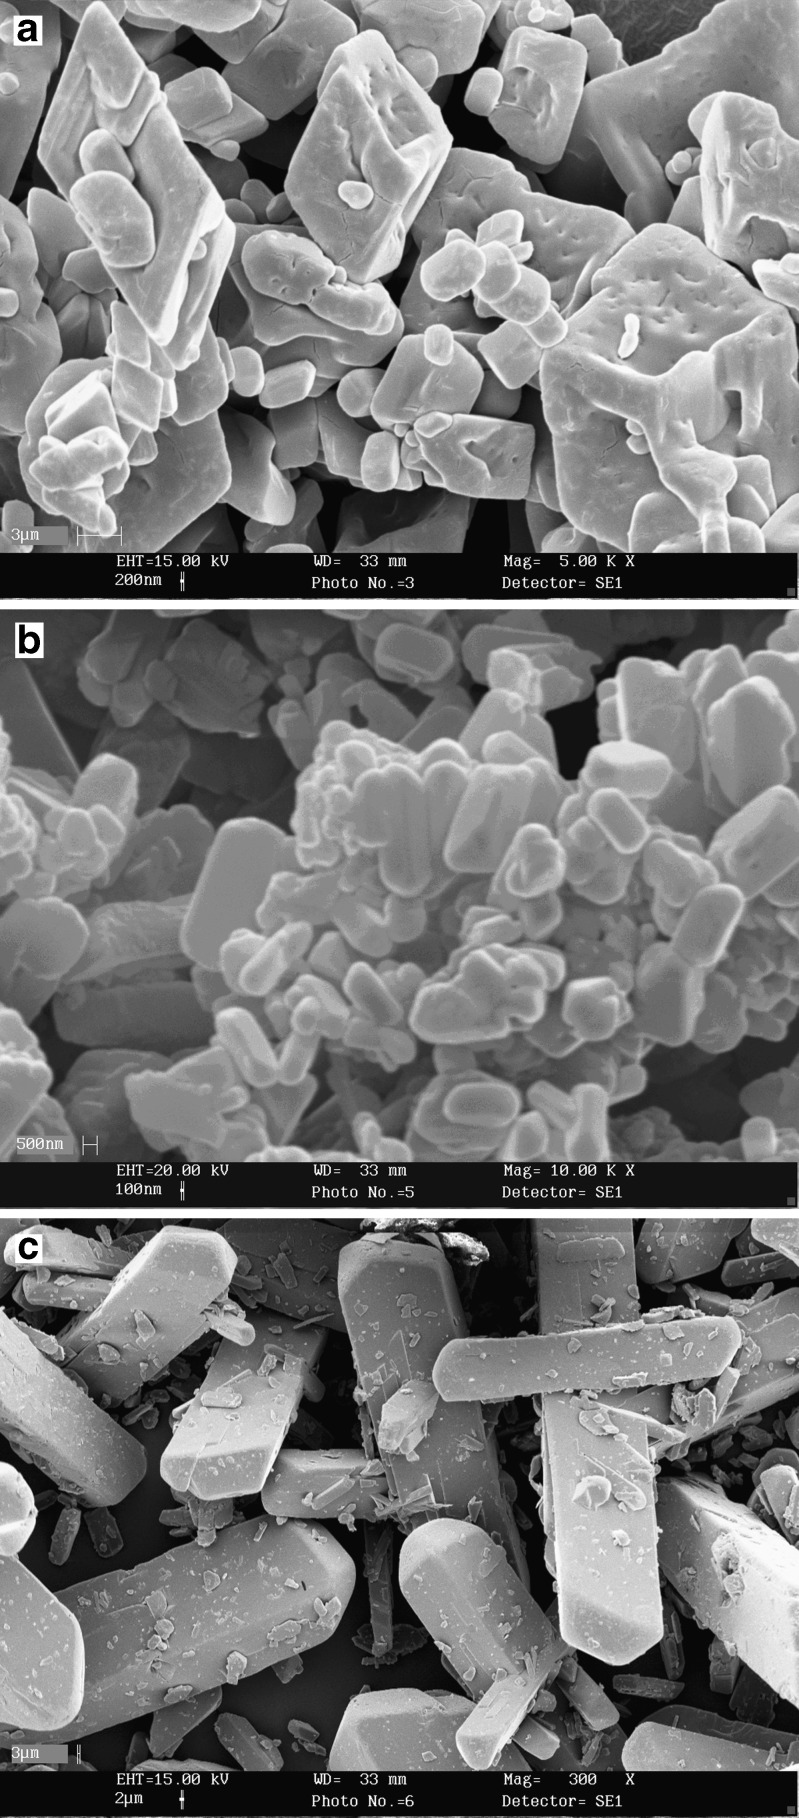
As can be seen from Table I, size reduction by the two methods of micronization are significant compared with the untreated powder of GL. The microcrystals of D0.3B0.05 obtained from pH-shift method are also significantly smaller than those prepared by the solvent-change method. Figure 1 also compares the differences in the morphology of the microcrystals compared with the untreated GL.
Table I.
Particle Size of Gliclazide Microcrystals Prepared by Solvent-Change and pH-Shift Methods, and Untreated Drug
| Formulation | Particle size (μm) | Span |
|---|---|---|
| Untreated drug | 290.00 ± 36.05 | 2.10 ± 0.20 |
| D0.5B0.05 | 9.90 ± 0.26 | 1.24 ± 0.02 |
| D0.3B0.05 | 4.76 ± 0.15 | 1.52 ± 0.02 |
Fig. 1.
Scanning electron micrographs of microcrystals. a D0.5B0.05 (magnification, ×5,000), b D0.3B0.05 (magnification, ×10,000), and c untreated GL (magnification, ×300)
Dissolution Studies
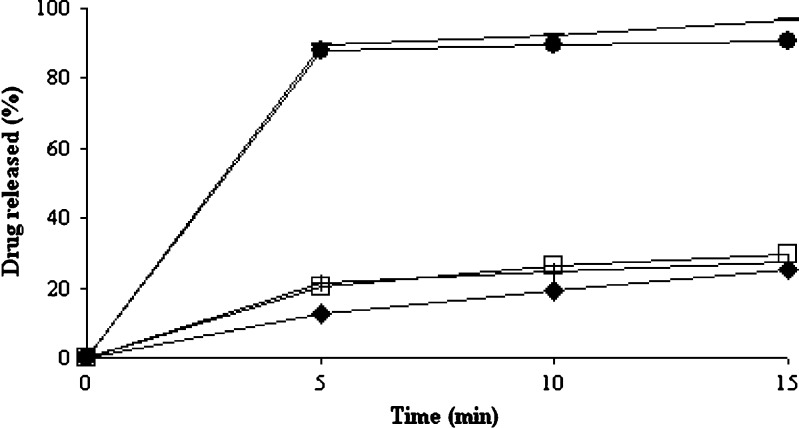
Different dissolution profiles of microcrystals are compared in Fig. 2. As this figure indicates the smaller particle size of microcrystals has caused higher dissolution rate compared with untreated drug or physical mixtures of GL and the stabilizers.
Fig. 2.
Dissolution profiles of microcrystal of D0.5B0.05 (filled squares), physical mixture of D0.5B0.05 (empty squares), microcrystal of D0.3B0.05 (dashed lines), physical mixture of D0.3B0.05 (plus signs), and untreated GL (filled diamonds)
HPLC Method
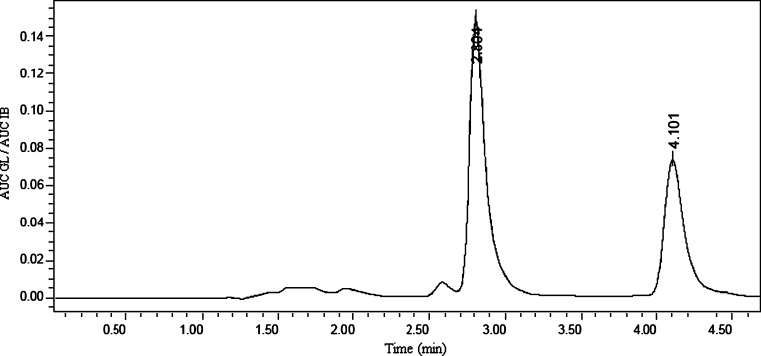
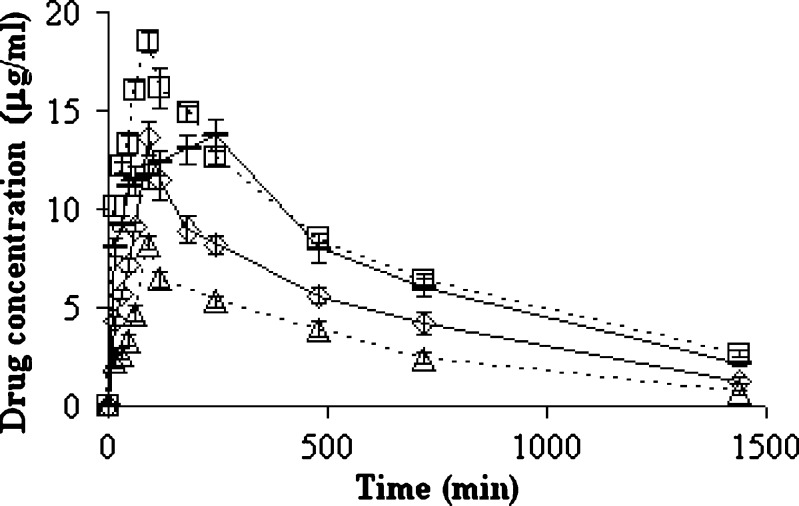
Gliclazide and IB that were used as internal standard were eluted at 2.8 and 4.1 min, respectively (Fig. 3). As reported elsewhere (Varshosaz et al., under consideration for publication in Scientia Pharm), the limit of quantification of microcrystals and untreated GL (LOQ; signal to noise ratio of 5:1, CV%< 10%) and the limit of detection (signal to noise ratio of 3:1) in plasma were 0.12 and 0.06 µg/ml, respectively. The recovery was obtained by comparing area under the peak of known plasma samples spiked with GL and IB to those of their respective aqueous solutions, correcting for volume. Mean recovery percent for GL and internal standard were 80% and 82%, respectively. The intra- and interday variations were obtained by repeating the standard curves three times each day and in three different days, respectively. The method was linear over the range of 0.12–200 µg/ml with r2 = 0.999 (Varshosaz et al., under consideration for publication in Scientia Pharm). Estimation of GL plasma concentration is indicated in Fig. 4.
Fig. 3.
HPLC chromatogram of GL (2.8 min) and IB (4 min) 90 min after administration of microcrystals (D0.3B0.05) containing 40 mg/kg GL to diabetic rats (n = 6)
Fig. 4.
Plasma concentrations of GL after oral administration of 40 mg/kg of untreated GL (dashed line) and 20 mg/kg (triangles, empty line), 30 mg/kg (diamonds), and 40 mg/kg (squares, empty line) of GL microcrystals prepared by pH-shift method (D0.3 B0.05) in diabetic rats (n=6)
In Vivo Studies
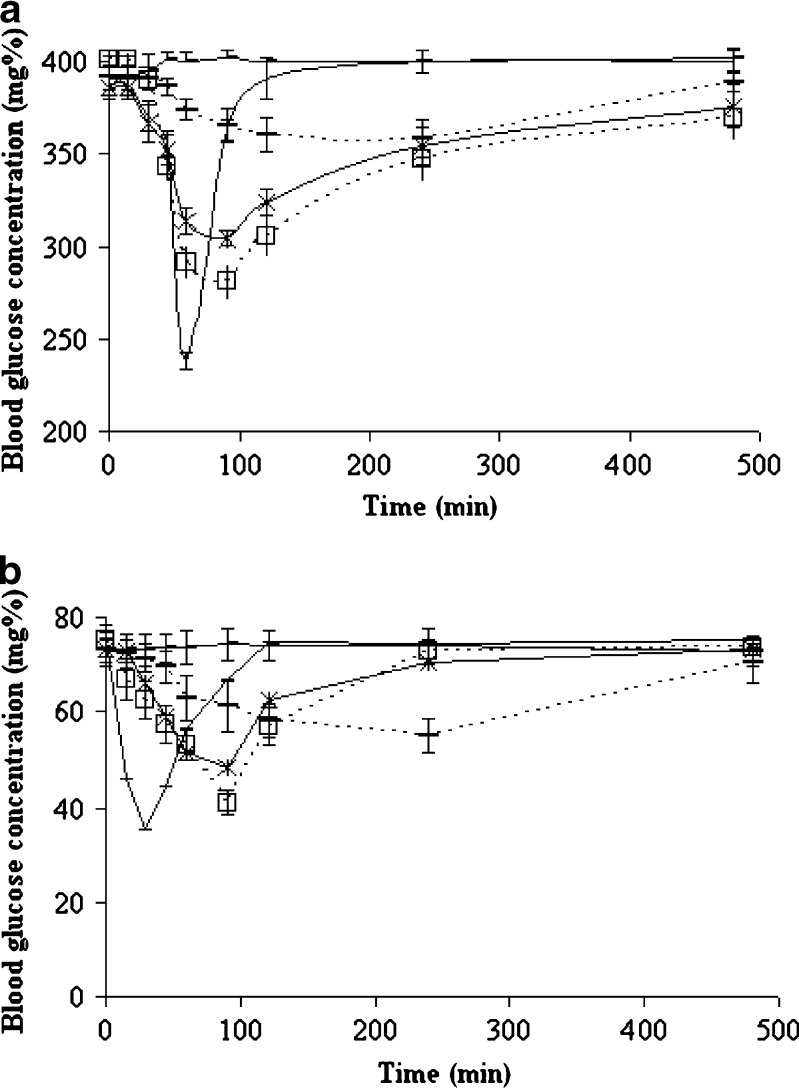
In order to investigate dose–response relationship in diabetic rats, 20, 30, and 40 mg/kg of pH-shift microcrystals were compared, and there was a linear relationship between Cmax and glucose-lowering effect of microcrystals (r2 = 0.9998, p < 0.05). Untreated GL has longer tmax and lower Cmax in comparison with the same dose of microcrystals that have shown more significant hypoglycemic effect than untreated GL in normal and diabetic rats (P < 0.05) (Fig. 5). The effect of insulin (2 IU/kg) in normal rats appeared and finished faster than diabetic ones. As a result, insulin (2 IU/kg) has glucose-lowering effect in normal and diabetic rats, but the effect was more than GL microcrystals in administered dose (40 mg/kg). In both of normal and diabetic rats, ka and ke were approximately the same, and the difference was in Cmax and AUC (P < 0.05) (Table II).
Fig. 5.
Blood glucose levels in control group (dashed line) and after oral administration of 40 mg/kg of untreated GL (dashed empty line), microcrystals of solvent-change method (D0.5 B0.05) (stars), pH-shift method (D0.3 B0.05) (squares, empty line), and insulin (2 IU/kg) (simple line) in a) diabetic and b) normal rats (n=6)
Table II.
Pharmacokinetic Parameters After Oral Administration of Untreated Gliclazide and Different Types of Gliclazide Microcrystals in Different Doses to Diabetic and Normal Rats (n=6)
| Intervention | T max (min) | C max (µg/ml) | AUC(0–∞) (µg h/ml) | k e (min−1) | k a (min−1) | Glucose reductiona (%) |
|---|---|---|---|---|---|---|
| D0.3B0.05 (pH shift) 40 mg/kg in normal rats | 90.23 ± 0.87 | 18.32 ± 0.29 | 14,968.27 ± 66.9 | 0.0015 ± 0.0003 | 0.0150 ± 0.0004 | 46.45 ± 0.66 |
| D0.3B0.05 (pH shift) 40 mg/kg in diabetic rats | 90.2 ± 1.9 | 18.33 ± 0.24 | 14,162.3 ± 71.4 | 0.0015 ± 0.0003 | 0.0160 ± 0.0010 | 29.39 ± 0.54 |
| D0.5B0.05 (solvent change) 40 mg/kg in normal rats | 90.13 ± 1.2 | 16.27 ± 0.17 | 13,630.33 ± 32.9 | 0.0015 ± 0.0004 | 0.0150 ± 0.0010 | 33.43 ± 1.12 |
| D0.5B0.05 (solvent change) 40 mg/kg in diabetic rats | 90.44 ± 0.7 | 16.27 ± 0.18 | 13,445.07 ± 46.6 | 0.0016 ± 0.0006 | 0.0150 ± 0.0010 | 20.79 ± 0.53 |
| D0.3B0.05 (pH shift) 30 mg/kg in diabetic rats | 90.8 ± 1.3 | 13.48 ± 0.36 | 9,062.14 ± 22.6 | 0.0015 ± 0.0002 | 0.0160 ± 0.0010 | 22.26 ± 0.61 |
| D0.3B0.05 (pH shift) 20 mg/kg in diabetic rats | 90 ± 1.5 | 8.2 ± 0.19 | 2,332.6 ± 41.9 | 0.0015 ± 0.0004 | 0.0150 ± 0.0005 | 14.78 ± 1.11 |
| Untreated GL 40 mg/kg in normal rats | 240.2 ± 2.6 | 13.08 ± 0.31 | 12,414.56 ± 15.6 | 0.0016 ± 0.0002 | 0.0090 ± 0.0002 | 21.12 ± 2.05 |
| Untreated GL 40 mg/kg in diabetic rats | 240.9 ± 1.9 | 13.43 ± 0.22 | 12,946.51 ± 49.4 | 0.0016 ± 0.0002 | 0.0080 ± 0.0003 | 8.35 ± 0.98 |
| Insulin (2 IU/kg) in normal rats | 30.8 ± 2.1 | 52.9 ± 4.4 | ||||
| Insulin (2 IU/kg) in diabetic rats | 60.1 ± 2.4 | 40.55 ± 2.17 |
aGlucose reduction % is the maximum glucose reduction that was reached after 90 min for microcrystal formulations, but for untreated GL, it was reached after 240 min
Regarding the in vivo biological assays for hypoglycemic activity in pH-shift method (Table II), the oral treatment with 40 mg/kg of GL microcrystals (D0.3B0.05) in normal rats led to a significant reduction (46.45 ± 0.66%) in the blood glucose levels after 90 min of treatment, and it was 24.33% more than the effect of untreated GL with the same dose in 240 min. In the treatment with 40 mg/kg of the same microcrystals on hyperglycemia induced by streptozotocin in rats, blood glucose levels were significantly reduced (29.39 ± 0.54%) after 90 min of treatment, and it was 21.04% more than the effect of untreated drug with the same dose in 240 min. Saline, used as negative control group, did not display any hypoglycemic activity.
Injection of insulin to diabetic and normal rats decreased the blood glucose level to 40.55 ± 2.17% and 52.9 ± 4.4%, respectively (Table II, Fig. 5). The results showed that both the normal and diabetic animals are sensitive to insulin, and in contrast to other studies (26), GL microcrystals have glucose-lowering effect on normal rats more than diabetics with approximately the same plasma GL concentration and pharmacokinetic parameters (P < 0.05) (Table II).
DISCUSSION
HPLC Method
The HPLC method used in this study is simple and easy for the detection of the drug (Varshosaz et al., under consideration for publication in Scientia Pharm). Ibuprofen used in this study as IS is more available than 4-hydroxybenzoate and nadoxolol, which were reported before (27,28). The LOQ of 0.5 µg/ml in previous studies is far above the sensitivity, which is needed in these investigations (29). The method used by Poirier et al. (27) needs 250 µl of plasma samples compared with 100 µl, which was used in modified method. The solid phase extraction procedure reported by Yu et al. (30) for sample preparation is an expensive sample clean-up method while the method used in the present study is based on a liquid–liquid extraction and has a shorter run time.
In Vivo Studies
As it is indicated in Table II, Cmax, AUC(0–∞), and ka show significant differences between treated and untreated crystals using the same dose (p < 0.05). For example, in diabetic rats, the administration of microcrystals prepared by pH-shift method showed that the values of Cmax and ka were 18.33 ± 0.24 μg/ml and 0.016 ± 0.001 min−1, respectively, whereas the values were 13.43 ± 0.22 μg/ml and 0.008 ± 0.00 min−1 for untreated GL. Increased and faster effect of microcrystals in comparison with untreated drug should be explained by increased dissolution rate, solubility, and specific surface area and decreased crystallinity of the drug because of the decreased particle size (31). There is a linear relationship between dose and effect (blood glucose reduction), and it can be concluded that there is no nonlinearity in dose–response in this range of doses.
It is approved that the insulin-increasing effect of GL is an important route of drug effect (32). As it is shown in Fig. 5, insulin acts more and faster than GL in normal and diabetic rats, but the blood glucose level returns faster to the levels as it was before treatment. Therefore, it should be concluded that GL effect remains longer than insulin that is an important advantage of the drug. The activity of insulin is considered negligible in streptozotocin-induced diabetic rats. Streptozotocin treatment damages the insulin-secreting beta cells, which are located in the pancreas responsible for secreting insulin (33). This can explain more affectivity of GL in normal rats in reducing blood glucose. The Cunha et al. investigations (34) also showed faster hypoglycemic effect in normal rats as a result of the hypoglycemic effect of Leandra lacunosa in comparison with alloxan-induced diabetic rats. Varshosaz et al. (31) also reported that sustained release chitosan beads containing GL had blood glucose-lowering effect on the normal rats while no effect was seen on the diabetic rats. The authors concluded that a possible reason was that the rats were chronically administered sulfonylureas with foods, which might induce secondary failure to sulfonylureas. These reports can explain the glucose-lowering effect of GL microcrystals in normal rats but not in the streptozotocin-diabetic ones.
CONCLUSION
In conclusion, the microcrystallization, which has an effect on GL crystal habit, can change the drug absorption characteristics. Microcrystallization of GL using both methods resulted in increased pharmacodynamic effect. D0.5B0.05 and D0.3B0.5 microcrystals from solvent-change and pH-shift methods, respectively, have shown more significant hypoglycemic effect than untreated GL in normal and diabetic rats (P < 0.05), which could be attributed to the enhanced dissolution rate of GL. Decreasing blood glucose level specially in microcrystals prepared by pH-shift method seems to be due to the dysfunction of insulin secretion in diabetic rats in comparison with normal ones.
Acknowledgment
This work was supported by the Vice Chancellor of Research of Isfahan University of Medical Sciences for financial support of this project.
References
- 1.Orienti I, Bigucci F, Luppi B, Cerchiara T, Zuccari G, Giunchedi P, et al. Polyvinylalcohol substituted with triethyleneglycolmonoethylether as a new material for preparation of solid dispersion of hydrophobic drugs. Eur J Pharm Biopharm. 2002;54:229–233. doi: 10.1016/S0939-6411(02)00055-3. [DOI] [PubMed] [Google Scholar]
- 2.Lobenberg R, Amidon GL. Modern bioavailability, bioequivalence and biopharmaceutics classification system. New scientific approaches to international regulatory standards. Eur J Pharm Biopharm. 2000;50:3–12. doi: 10.1016/S0939-6411(00)00091-6. [DOI] [PubMed] [Google Scholar]
- 3.Sarkari M, Brown J, Chen X, Swinnea S, William RO, Johnston KP. Enhanced drug dissolution using evaporative precipitation into aqueous solution. Int J Pharm. 2002;243:17–31. doi: 10.1016/S0378-5173(02)00072-8. [DOI] [PubMed] [Google Scholar]
- 4.Gibson M. Pharmaceutical preformulation and formulation—a practical guide from candidate drug selection to commercial dosage form. Englewood: HIS Health Group; 2001. [Google Scholar]
- 5.Kim ST, Kwon JH, Lee JJ, Kim CW. Microcrystallization of indomethacin using a pH-shift method. Int J Pharm. 2003;263(1–2):141–150. doi: 10.1016/S0378-5173(03)00358-2. [DOI] [PubMed] [Google Scholar]
- 6.Chaumeil JC. Micronization: a method of improving the bioavailability of poorly soluble drugs. Meth Find Exp Clin Pharmacol. 1998;20:211–215. [PubMed] [Google Scholar]
- 7.Rasenack N, Muller BW. Dissolution rate enhancement by in situ micronization of poorly water-soluble drugs. Pharm Res. 2002;19(12):1894–1900. doi: 10.1023/A:1021410028371. [DOI] [PubMed] [Google Scholar]
- 8.Steckel H, Rasenack N, Muller BW. In situ micronization of disodiumcromoglycate for pulmonary delivery. Eur J Pharm Biopharm. 2003;55:173–180. doi: 10.1016/S0939-6411(02)00168-6. [DOI] [PubMed] [Google Scholar]
- 9.Williams RO, III, Brown J, Liu J. Influence of micronization method on the performance of a suspension triamcinolone acetonide pressurized metered-dose inhaler formulation. Pharm Dev Tech. 1999;4(2):167–179. doi: 10.1081/PDT-100101351. [DOI] [PubMed] [Google Scholar]
- 10.Huang QP, Wang JX, Chen GZ, Shen ZG, Chen JF, Yun J. Micronization of gemfibrozil by reactive precipitation process. Int J Pharm. 2008;360:58–64. doi: 10.1016/j.ijpharm.2008.04.026. [DOI] [PubMed] [Google Scholar]
- 11.Zhang HX, Wang JX, Zhang ZB, Le Y, Shen ZG, Chen JF. Micronization of atorvastatin calcium by antisolvent precipitation process. Int J Pharm. 2009;374(1–2):106–113. doi: 10.1016/j.ijpharm.2009.02.015. [DOI] [PubMed] [Google Scholar]
- 12.Giry K, Pean JM, Giraud L, Marsas S, Rolland H, Wuthrich P. Drug/lactose co-micronization by jet milling to improve aerosolization properties of a powder for inhalation. Int J Pharm. 2006;321:162–166. doi: 10.1016/j.ijpharm.2006.05.009. [DOI] [PubMed] [Google Scholar]
- 13.Moribe K, Tsutsumi S, Morishita S, Shinozaki H, Tozuka Y, Oguchi T, Yamamoto K. Micronization of phenylbutazone by rapid expansion of supercritical CO2 solution. Chem Pharm Bull. 2005;53(8):1025–1028. doi: 10.1248/cpb.53.1025. [DOI] [PubMed] [Google Scholar]
- 14.Betageri GV, Makarla KR. Enhancement of dissolution of glyburide by solid dispersion and lyophylization techniques. Int J Pharm. 1995;126:155–160. doi: 10.1016/0378-5173(95)04114-1. [DOI] [Google Scholar]
- 15.Palmer KJ, Brogden RN. Gliclazide. An update of its pharmacological properties and therapeutic efficacy in non-insulin-dependent diabetes mellitus. Drugs. 1993;46:93–125. doi: 10.2165/00003495-199346010-00007. [DOI] [PubMed] [Google Scholar]
- 16.Arias-Blanco MJ, Moyano JR, Perez-Martinez JI, Gines JM. Study of the inclusion of GL in α-cyclodextrin. J Pharm Biomed Anal. 1998;18:275–279. doi: 10.1016/S0731-7085(98)00179-4. [DOI] [PubMed] [Google Scholar]
- 17.Ozkan Y, Atay T, Dikmen N, Isimer A, Aboul-Enein HY. Improvement of water solubility and in vitro dissolution rate of GL by complexation with β-cyclodextrin. Pharm Act Helv. 2000;74:365–370. doi: 10.1016/S0031-6865(99)00063-1. [DOI] [PubMed] [Google Scholar]
- 18.Aggarwal S, Singh PN, Mishra B. Studies on solubility and hypoglycemic activity of gliclazide beta-cyclodextrin-hydroxypropylmethylcellulose complexes. Pharmazie. 2002;57(3):191–193. [PubMed] [Google Scholar]
- 19.Moyano JR, Arias-Blanco MJ, Gines JM, Rabasco AM, Perez-Martinez JI, Mor M, et al. Nuclear magnetic resonance investigation of the inclusion complexation of GL with β-cyclodextrin. J Pharm Sci. 1997;86(1):72–75. doi: 10.1021/js960212n. [DOI] [PubMed] [Google Scholar]
- 20.Varshosaz J, Talari R, Mostafavi A, Nokhodchi A. Dissolution enhancement of gliclazide using in situ micronization by solvent change method. Powder Tech. 2008;187:222–230. doi: 10.1016/j.powtec.2008.02.018. [DOI] [Google Scholar]
- 21.Talari R, Varshosaz J, Mostafavi A, Nokhodchi A. Dissolution enhancement of gliclazide using pH change approach in Presence of Twelve Stabilizers with Various Physico-Chemical Properties. J Pharm Pharmaceutic Sci. 2009;12(3):250–265. doi: 10.18433/j31p4p. [DOI] [PubMed] [Google Scholar]
- 22.Rouini MR, Mohajer A, Tahami MH. A simple and sensitive HPLC method for determination of gliclazide in human serum. J Chromatography B. 2003;785:383–386. doi: 10.1016/S1570-0232(02)00951-0. [DOI] [PubMed] [Google Scholar]
- 23.Jaiswal D, Rai PK, Kumar A, Mehta S, Watal G. Effect of Moringa oleifera Lam. Leaves aqueous extract therapy on hyperglycemic rats. J Ethnopharmacol. 2009;123(3):392–396. doi: 10.1016/j.jep.2009.03.036. [DOI] [PubMed] [Google Scholar]
- 24.Weiss J, Taylor GR, Zimmermann F, Nebendahl K. Collection of body fluids. In: Krinke GJ, editor. The handbook of experimental animals, the laboratory rat. San Diego: Academic; 2000. pp. 488–489. [Google Scholar]
- 25.Gibaldi M, Perrier D. Pharmacokinetics. 2. New York: Marcel Dekker; 1982. pp. 149–151. [Google Scholar]
- 26.Pandikumar P, Prakash Babu N, Ignacimuthu S. Hypoglycemic and antihyperglycemic effect of Begonia malabarica Lam. in normal and streptozotocin induced diabetic rats. J Ethnopharmacol. 2009;124:111–115. doi: 10.1016/j.jep.2009.04.001. [DOI] [PubMed] [Google Scholar]
- 27.Kuo CY, Wu SM. High-performance liquid chromatography with electrochemical detection for analysis of gliclazide in plasma. J Chromatogr A. 2005;1088:131–135. doi: 10.1016/j.chroma.2004.12.097. [DOI] [PubMed] [Google Scholar]
- 28.Poirier JM, Perez M, Cheymol G. High-performance liquid chromatographic determination of gliclazide in human plasma. J Chromatogr. 1987;421:223–226. doi: 10.1016/0378-4347(87)80402-4. [DOI] [PubMed] [Google Scholar]
- 29.Charles BG, Ravenscroft PJ. Measurement of gliclazide in plasma by radial compression reversed-phase liquid chromatography. Clin Chem. 1984;30:1789–1791. [PubMed] [Google Scholar]
- 30.Yu NH, Ho ENM, Tang FPW, Wan TSM, Wong ASY. Comprehensive screening of acidic and neutral drugs in equine plasma by liquid chromatography–tandem mass spectrometry. J Chrom A. 2008;1189:426–434. doi: 10.1016/j.chroma.2007.11.022. [DOI] [PubMed] [Google Scholar]
- 31.Varshosaz J, Tavakoli N, Minayian M, Rahdari N. Applying the Taguchi design for optimized formulation of sustained-release gliclazide chitosan beads: an in vitro/in vivo study. AAPS Pharm Sci Tech. 2009;10(1):158–165. doi: 10.1208/s12249-009-9191-8. [DOI] [PMC free article] [PubMed] [Google Scholar]
- 32.Tanira MOM, Furman BL. The in vivo interaction between gliclazide and glibenclamide and insulin on glucose disposal in the rat. Pharmacol Res. 1999;39:349–356. doi: 10.1006/phrs.1998.0446. [DOI] [PubMed] [Google Scholar]
- 33.Gholamhoseinian A, Fallah H, Sharififar F. Inhibitory effect of methanol extract of Rosa damascena Mill. Flowers on α-glucosidase activity and postprandial hyperglycemia in normal and diabetic rats. Phytomedicine. 2009;16(10):935–941. doi: 10.1016/j.phymed.2009.02.020. [DOI] [PubMed] [Google Scholar]
- 34.Cunha WR, Arantes GM, Ferreira DS, Lucarini R, Silva MLA, Furtado NAJC, et al. Hypoglycemic effect of Leandra lacunosa in normal and alloxan-induced diabetic rats. Fitoterapia. 2008;79:356–360. doi: 10.1016/j.fitote.2008.04.002. [DOI] [PubMed] [Google Scholar]


