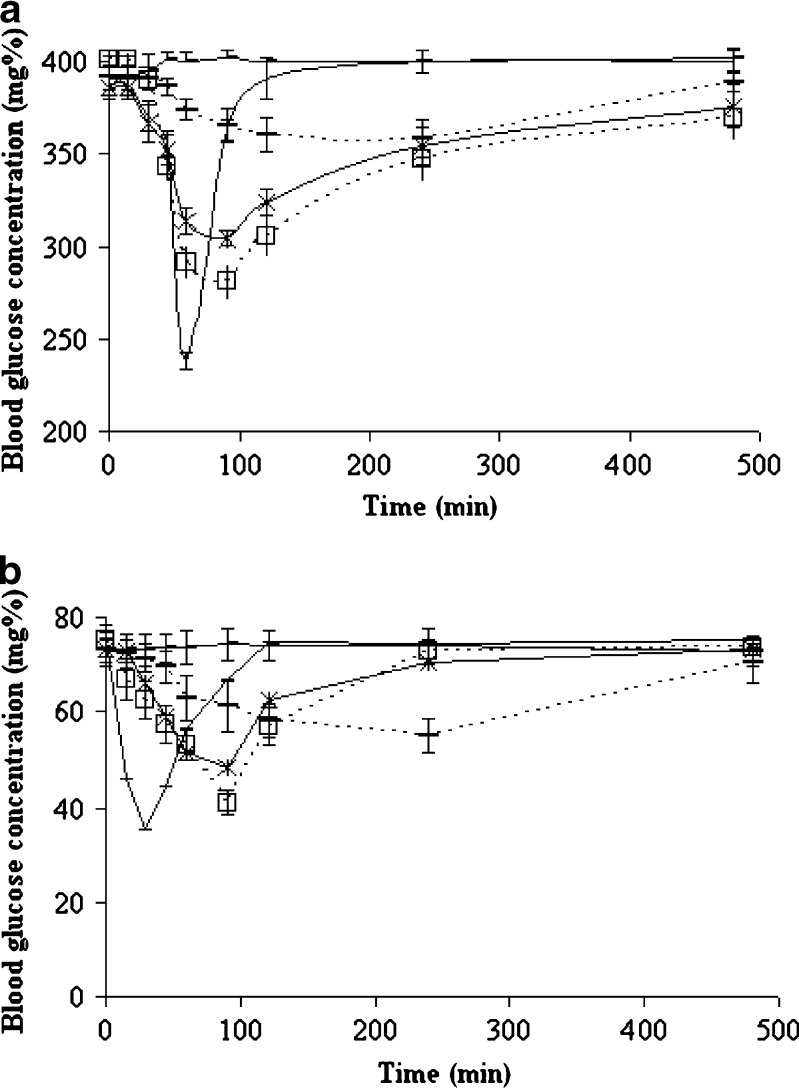
Fig. 5.
Blood glucose levels in control group (dashed line) and after oral administration of 40 mg/kg of untreated GL (dashed empty line), microcrystals of solvent-change method (D0.5 B0.05) (stars), pH-shift method (D0.3 B0.05) (squares, empty line), and insulin (2 IU/kg) (simple line) in a) diabetic and b) normal rats (n=6)

