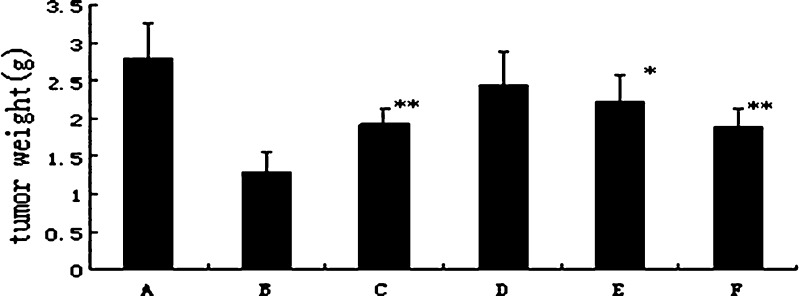
Fig. 5.
The weight of transplantable tumor on mice after treatment with BJOL and BJOE at different doses of BJO. Each point represents the mean ± SD (n = 10). A Control. B Cyclophosphamide (CTX). C Emulsions 180. D Liposomes 60. E Liposomes 120. F Liposomes 180. Results were tested for significance using t test. Significance levels: single asterisk, p < 0.05; double asterisk, p < 0.01

