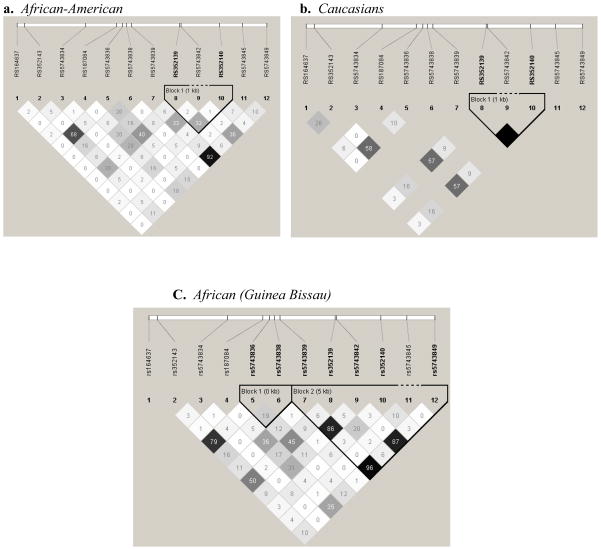
Fig. 2.
Linkage disequilibrium structure (r2) for TLR2 in controls. LD plots were generated in Haploview and are presented for: a African-Americans, b Caucasians, c Africans (Guinea-Bissau). Within each triangle is presented the pairwise correlation coefficient (r2). Standard color-coding was used for the Haploview LD plots, white, (r2 = 0), shades of gray, (0 < r2 < 1), black, (r2 = 1). Black squares without numbers indicate complete LD (r2 = 1.00).

