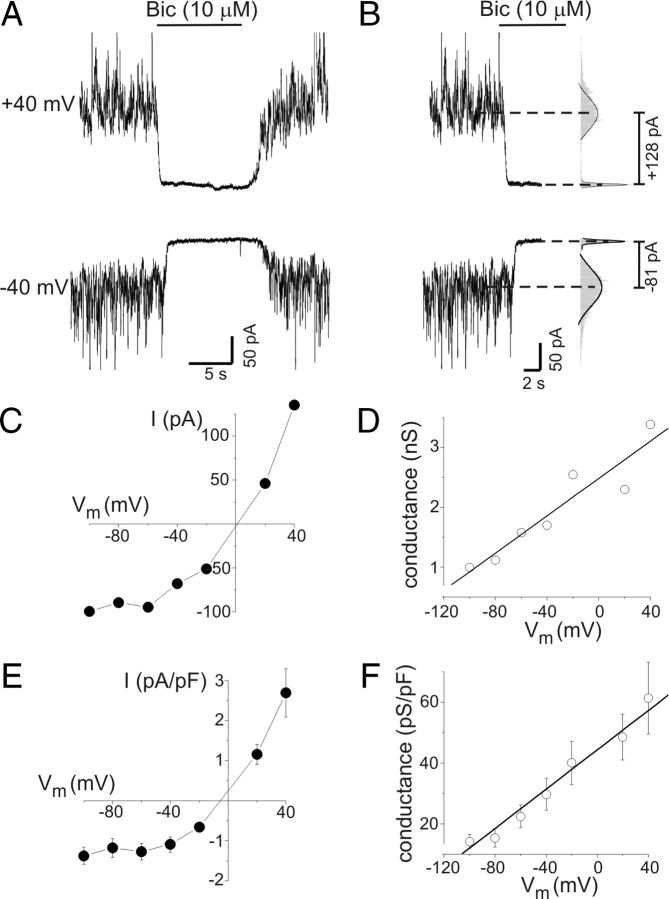
Figure 1.
Tonic GABAA conductance in rat hippocampal neurons increased with depolarization. A, Tonic GABAA receptor-mediated currents at −40 and +40 mV. The horizontal bars indicate period of bicuculline application (10 μm; Bic) in this and subsequent panels. B, Quantification of tonic current amplitude. All-points histograms were created from current data before and after Bic application (gray bars in right panel). The peaks of these histograms were fit with a Gaussian equation (solid lines in right panel) to determine mean current amplitudes (dashed lines). Tonic current was defined as change in mean holding current produced by bicuculline. C, Current–voltage (I–V) plot from the neuron in A. Values are means of two to three measurements at each potential. Tonic currents were outwardly rectifying. D, Tonic chord conductance as a function of voltage from data illustrated in A–C. Tonic conductance increased in a near-linear fashion with membrane depolarization. The solid line represents a linear fit of the data (slope, 13 pS/mV). E, Mean current density as a function of voltage for all neurons tested (n = 12). F, Mean capacitance-specific conductance as a function of voltage for all neurons tested (n = 12). Linear fit of the data had a slope of 0.32 pS · pF−1 · mV−1. Error bars represent SEM.

