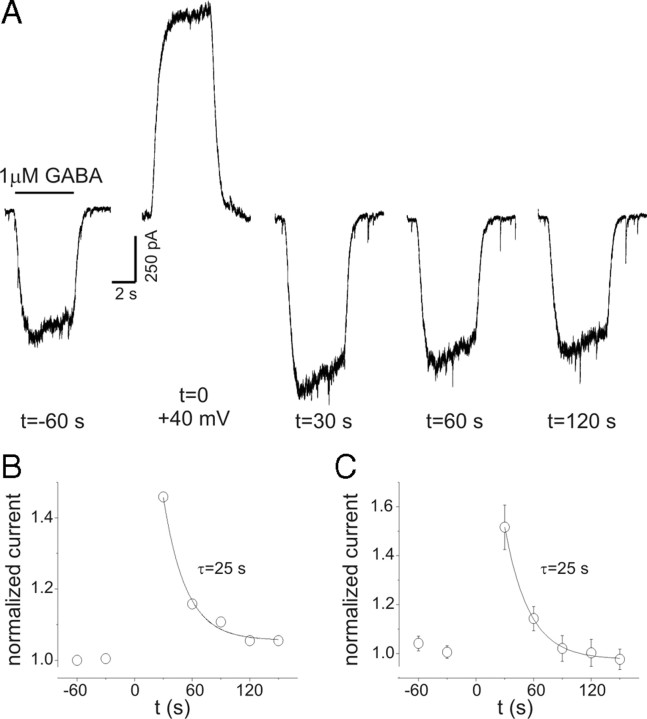
Figure 4.
PDP of GABA currents. A, Current recordings during repeated GABA applications (1 μm; 5 s) at indicated times (holding potential, −60 mV). At t = 0, GABA was applied at +40 mV (note the slow activation of the GABA response similar to that seen in Fig. 3). Both peak and “steady-state” current at −60 mV were increased when measured 30 s after GABAA receptor activation at +40 mV. PDP of steady-state currents was 46% in this neuron. Baselines are adjusted to allow comparison of currents. B, Time course of normalized steady-state current amplitudes for data in A. The solid line represents a single exponential function fit to the data. Time constant for recovery of PDP was 25 s. C, Mean data from experiments on five cells as in A. The time constant for recovery was also 25 s. Error bars represent SEM.

