Figure 5.
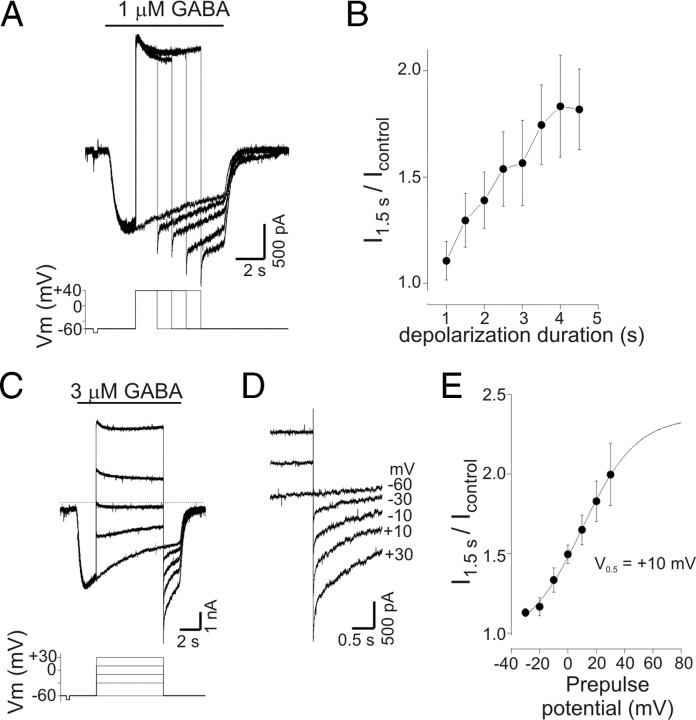
PDP of GABA current was time and voltage dependent. A, Current responses to GABA (1 μm) with step depolarizations of increasing duration. Duration of initial depolarization was 1 s and increased by 0.5 s with each subsequent trial (not all traces shown; illustrated traces are for 0, 1.5, 2.5, 3.5, and 4.5 s of depolarization). A progressive increase in current amplitude was seen on repolarization as the duration of the preceding depolarization increased. The bottom panel shows command potentials. Note that the current after 2.5 s of depolarization was larger than the peak current produced by GABA alone. B, Mean potentiation of current as a function of depolarization duration. Current was measured 1.5 s after repolarization and normalized to current values at corresponding time point of control trace (−60 mV) from experiments as in A (n = 4). C, GABA-evoked currents (3 μm) with step depolarization to a range of potentials from −30 to +30 mV. Current at −60 mV was potentiated by transient depolarization to −30 mV (compared with control current recorded at −60 mV) and increased progressively as the magnitude of the preceding depolarization increased. D, Data from C on expanded timescale illustrating the current increase seen on repolarization. Labels refer to value of preceding depolarization (−60 mV is control). E, Mean normalized current at −60 mV as a function of prepulse potential. Current was measured 1.5 s after repolarization and normalized to corresponding time point of control trace (n = 4). Data are from experiments as in C. The solid line represents a Boltzmann equation fit to the data; the apparent half-maximal voltage (V0.5) for PDP of GABA current was +10 mV. Error bars represent SEM.

