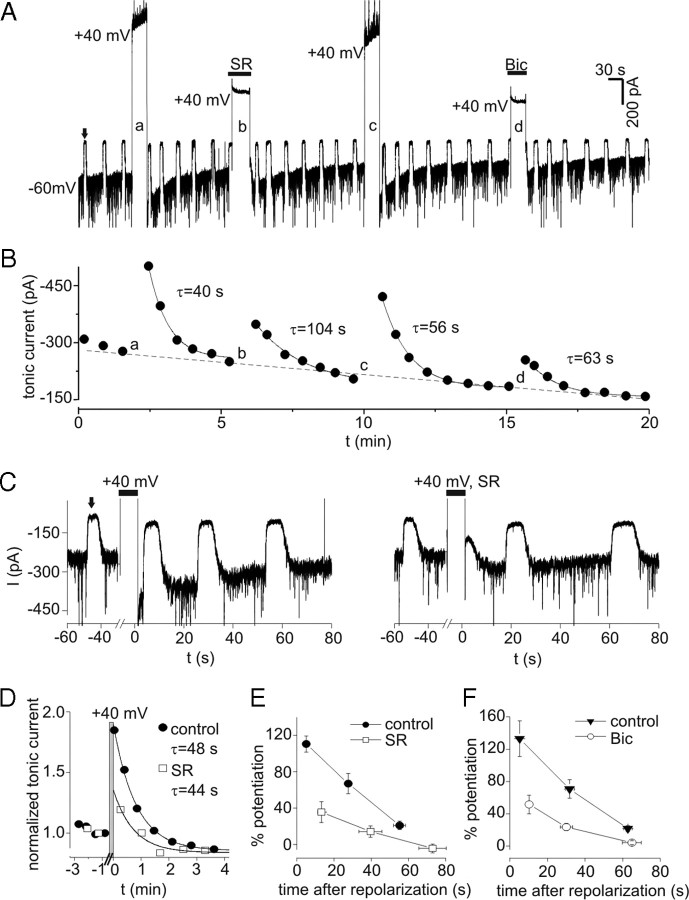
Figure 6.
PDP of tonic currents. A, Tonic currents in the presence of low levels of exogenous GABA (0.3 μm). Upward deflections (e.g., the one indicated by solid arrow) represent response to 10 μm bicuculline (Bic) used to measure tonic current amplitude. Tonic current at −60 mV was increased by transient depolarization to +40 mV (large upward deflections). This increase was attenuated when depolarization occurred in the presence of the GABAA receptor antagonists SR (100 μm) or Bic (10 μm). B, Tonic current amplitude from experiment in A. The solid lines represent single exponential fits, and time constants (τ) for recovery after each depolarization are indicated. The lowercase letters refer to sequentially labeled depolarizations in A. Note the progressive rundown of tonic current over duration of experiment (dashed line), which was seen in 11 of 11 cells studied with 0.3 μm GABA. C, PDP of tonic currents under control conditions (left panel) and when depolarization occurred in the presence of SR (right panel) on expanded timescale (different neuron than in A and B). Wash off of SR occurred in <10 s and was complete before measuring tonic current with Bic. D, Normalized tonic current from data in C. Data were normalized to value immediately preceding each depolarization and aligned so that repolarization occurred at t = 0. The gray bar indicates period of depolarization to +40 mV. PDP induced in the presence of SR was reduced compared to control for 1 min after repolarization, much longer than the time required for wash of SR. The solid lines are single exponential fits to data with indicated time constants. E, Mean potentiation of tonic current versus time after repolarization for experiments with and without SR. Peak PDP with SR was significantly reduced compared with both the first and second measurements under control conditions (p < 0.01; n = 5). F, Potentiation of tonic current versus time after repolarization for experiments with and without Bic. PDP induced in Bic was significantly reduced compared with each corresponding control measurement (p < 0.01; n = 6). Error bars represent SEM.

