Figure 7.
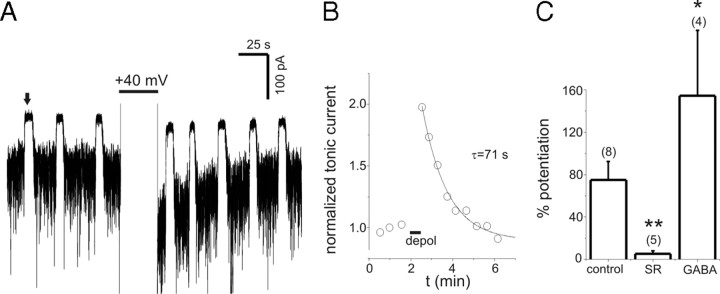
PDP of endogenous tonic currents. A, Tonic currents caused by endogenous GABA before and after depolarization to +40 mV. Period of depolarization is clipped to display the PDP of tonic current. Upward deflections (e.g., the one indicated by arrow) are the response to 10 μm bicuculline (Bic). B, Time course of normalized tonic current from A. The solid line is a single exponential fit with indicated time constant. C, Summary of peak PDP for tonic current caused by endogenous GABA. Depolarization in the presence of 100 μm SR attenuated PDP of endogenous tonic currents. PDP of endogenous tonic currents was increased by a 5 s application of exogenous GABA (1 μm) during the period of depolarization only (GABA). **p < 0.01; *p < 0.05. Error bars represent SEM.

