Figure 8.
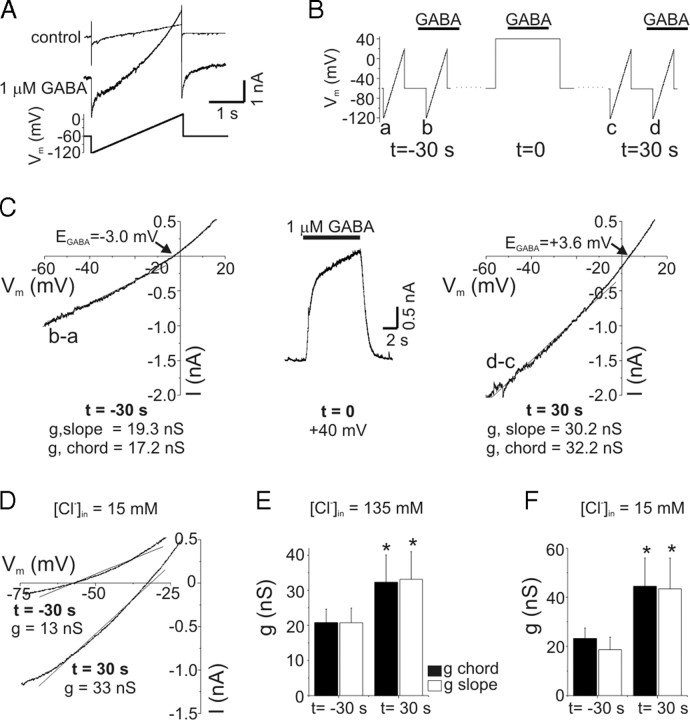
PDP of GABA current resulted from increased conductance. A, Membrane currents in response to voltage ramps before (control) and after GABA application (1 μm). The GABA-evoked ramp current (“difference current”) was obtained from point-by-point subtraction of these data for determination of reversal potential (i.e., EGABA) and slope conductance. B, Schematic of experimental protocol. Difference currents were obtained with voltage ramps 30 s before (t = −30 s) GABA was applied to a neuron depolarized to +40 mV (t = 0) and then 30 s after this depolarization (t = 30 s). C, GABA-evoked ramp currents during PDP. Difference currents are plotted as a function of voltage in the left (t = −30 s) and right (t = 30 s) panels. The middle panel shows GABA response at +40 mV (t = 0). Slope conductance was determined from a linear fit to current between −60 and −10 mV (solid lines in left and right panels). Chord conductance was calculated using the measured EGABA (indicated in figure) and current at −60 mV. Voltage ramps were given ∼2 s into GABA applications. Slope and chord conductance were both increased by depolarization (values in figure). D, GABA-evoked (3 μm) ramp currents from a neuron recorded with pipette solution containing 15 mm Cl−. The protocol is the same as in B and C. EGABA shifted from −57 mV at baseline (t = −30 s) to −32 mV after depolarization (t = 30 s). Slope conductances are indicated in figure. E, Mean values of slope and chord conductance for experiments with [Cl−]in = 135 mm. The slope and chord conductances were increased by 60 and 56%, respectively (n = 5; p < 0.05). The legend applies to this panel and F. Data with [Cl−]in = 135 mm were pooled from experiments with 1–3 μm GABA. F, Mean values of slope and chord conductance for experiments with [Cl−]in = 15 mm. During PDP with [Cl−]in = 15 mm, conductance was increased by 91–132% (n = 5; p < 0.05). Data with [Cl−]in = 15 mm were obtained with 3 μm GABA. Error bars represent SEM. *p < 0.05.

