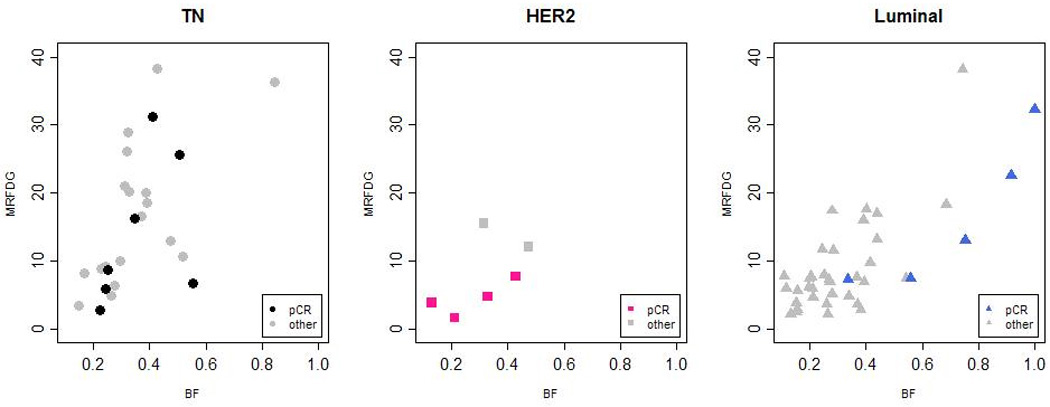
Figure 4.

MRFDG (µmol/min/100 g) and BF (mL/min/g) for each subtype. Light shaded symbols represent non-responders, dark shaded symbols represent patients who achieved pathologic complete response (pCR). ● represents pCR in TN tumors, ■ represents pCR in HER2 tumors, ▲ represents pCR in luminal tumors.
