Fig. 1.
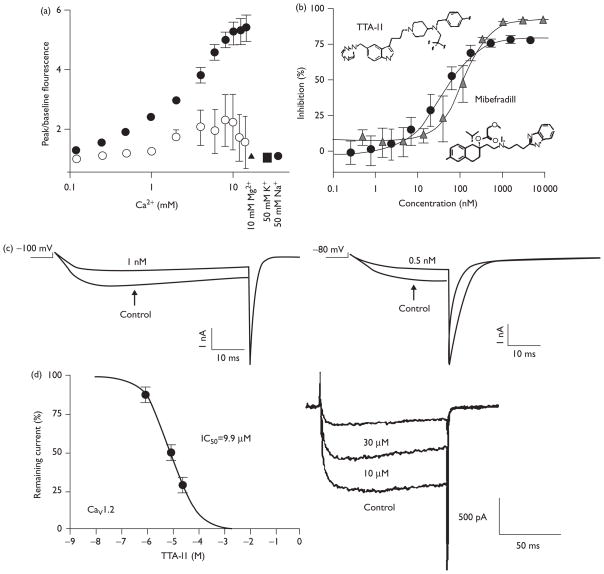
The T-type channel antagonist TTA-I1. (a) The fluorescence signal depends on channel expression and the calcium concentration gradient. Cells were plated and grown overnight in the absence (open circles) or presence (filled symbols) of tetracycline to induce CACNA1I expression. Signal was elicited by adding various concentrations of calcium, 10 mM Mg2 + (filled triangle), 50 mM K+ (filled square) or 50 mM Na+ (filled hexagon). Fluorescent signal is reported as a fold-increase over baseline. Values shown are mean ± SD. (b) Concentration-inhibition curves are plotted for TTA-I1 (black circles) and mibefradil (gray triangles). Values plotted are mean ± SD. (c) CACNA1I current tracings in the absence and presence of TTA-I1. Currents were elicited by depolarizations from a holding potential of −100 mV (left, 1.0 nM TTA-I1) or −80 mV (right, 0.5 nM TTA-I1). (d) CACNA1C current tracings at 0, 10 and 30 μM TTA-1I elicited from a holding potential of −90 mV.

