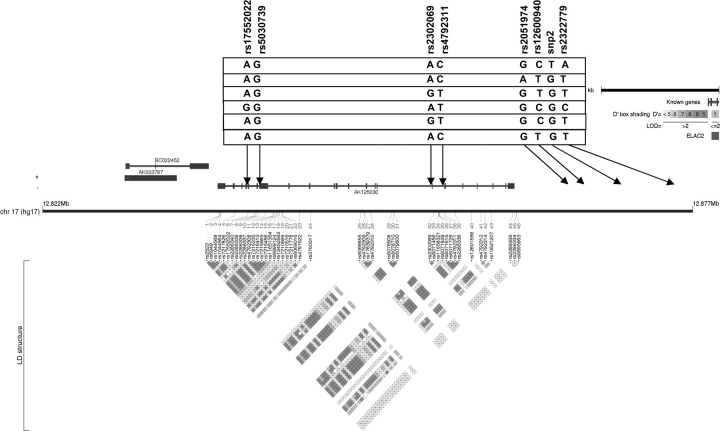
Fig. 1.
ELAC2 linkage disequilibrium plot. This plot was generated by Haploview and Locusview programs. When the approach of Gabriel et al. was used, the eight SNPs formed one block. The rs number on the top from left to right corresponds to the SNP name (e.g. snp1, snp2, etc.). The level of pairwise D′, which indicates the degree of linkage disequilibrium between two SNPs, is shown in the linkage disequilibrium structure in red. Six common haplotypes (frequency > 0.05) were identified.

